If you have Likert-10 data for two groups, you could compare the two groups using a two-sample Wilcoxon rank sum test. Hypothetical data and test below with 200 subjects in each group.
Data and summary: The p vectors show relative 'popularities' of the score from 0 to 10 in each group.
set.seed(2020)
x1 = sample(1:10, 200, repl=TRUE, p=c(1,2,3,4,5,6,4,3,2,1))
x2 = sample(1:10, 200, repl=TRUE, p=c(1,1,2,3,4,5,6,7,6,5))

table(x1)
x1
 1  2  3  4  5  6  7  8  9 10
 6 13 21 32 26 37 29 15 12  9
table(x2)
x2
 1  2  3  4  5  6  7  8  9 10
 7  5  5 19 23 23 29 42 25 22

summary(x1)
   Min. 1st Qu.  Median    Mean 3rd Qu.    Max.
   1.00    4.00    6.00    5.48    7.00   10.00
summary(x2)
   Min. 1st Qu.  Median    Mean 3rd Qu.    Max.
  1.000   5.000   7.000   6.725   8.000  10.000
Wilcoxon test shows a highly significant difference between the two groups with a P-value near $0.$
wilcox.test(x1,x2)

         Wilcoxon rank sum test
         with continuity correction

data:  x1 and x2
W = 13606, p-value = 2.524e-08
alternative hypothesis:
  true location shift is not equal to 0
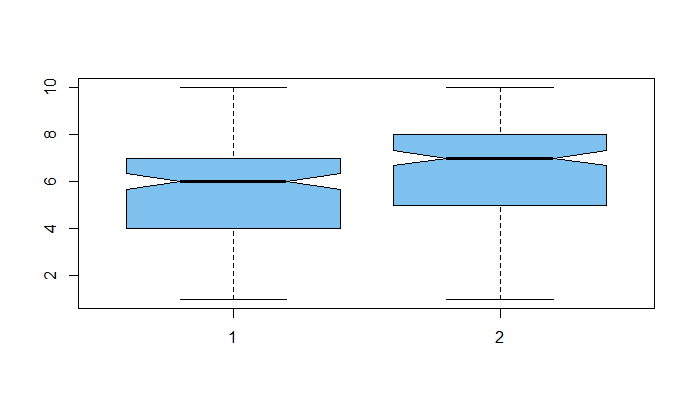
'Notched' boxplots. Here are boxplots of the two samples of Likert-10 scores. That the 'notches' in the sides of the boxes do not overlap suggests that the two groups differ.
boxplot(x1,x2, notch=TRUE, col="skyblue2")