AI/ML News & Innovations Hub

AI/ML news, top picks, and generated innovation digests.

★ Visit ai-karthik.com
422Sources
27534News Items
8Top Picks
166Blogs
failedLast Run

Latest AI/ML News

27534 matching items

Cross Validated 2024-01-17 11:23 UTC Score 15.0 AI-113-20240117-social-media-b6b02d4e

Dimension Mismatch in Transformer Decoder: What Are the Input and Output Dimensions?

My understanding is that in the decoder, the output of the masked self-attention mechanism is expected to have dimensions (o_len,d_model), where o_len is the current output length. However, an issue arises when the keys (K) and values (V) used in the self-attention of the decoder are obtained from the output of the encoder. Their dimensions are (n, d_model), where n represents the number of embedding vectors. This poses a problem during the computation of Q x K^T because Q has size (o_len,dq), while K^T has a size of(d_model,n), and dq is not equal to dmodel. ​

Chip Huyen Blog 2024-01-16 00:00 UTC Score 44.0 USR-0111-20240116-ai-specialis-9651fc41 Full article

Generation configurations: temperature, top-k, top-p, and test time compute

ML models are probabilistic. Imagine that you want to know what’s the best cuisine in the world. If you ask someone this question twice, a minute apart, their answers both times should be the same. If you ask a model the same question twice, its answer can change. If the model thinks that Vietnamese cuisine has a 70% chance of being the best cuisine and Italian cuisine has a 30% chance, it’ll answer “Vietnamese” 70% of the time, and “Italian” 30%. This probabilistic nature makes AI great for creative tasks. What is creativity but the ability to explore beyond the common possibilities, to think outside the box? However, this probabilistic nature also causes inconsistency and hallucinations. It’s fatal for tasks that depend on factuality. Recently, I went over 3 months’ worth of customer support requests of an AI startup I advise and found that ⅕ of the questions are because users don’t understand or don’t know how to work with this probabilistic nature. To understand why AI’s responses are probabilistic, we need to understand how models generate responses, a process known as sampling (or decoding). This post consists of 3 parts. Sampling : sampling strategies and sampling variables including temperature, top-k, and top-p. Test time compute : increasing the compute allocated to inference, e.g. sampling multiple outputs, to help improve a model’s performance. Structured outputs : how to get models to generate outputs in a certain format. Sampling Given an input, a neural networ…

Block size in subsampling and bootstrap for time series
Cross Validated 2024-01-14 20:13 UTC Score 12.0 AI-113-20240114-social-media-782c03c3 Full article

Block size in subsampling and bootstrap for time series

I have a dependent variable, a time series of 80 periods (discrete decisions). I am doing maximum likelihood estimation with 10 parameters. Now I want to get the standard error or confidence interval of the estimates of these 10 parameters. One feature of my likelihood function is that the decisions is determined by all the history of $x$ , and the weight of past $x$ decreases geometrically: $x_t+\rho x_{t-1}+\rho^2 x_{t-2}$ ... where $\rho$ is one of the parameters needed to be estimated. So I am thinking that moving block bootstrapping perhaps is not suitable to sustain the data structure, and I should use subsampling. But subsampling of a given block size leaves me a very few subsamples. For example, if I choose a block size of 40, I get only 41 subsamples. Should I concern about it? Is it sufficient? Can I use multiple block sizes to construct a confidence interval? Is there any other alternatives that I could use to get standard error or confidence interval?

Cross Validated 2024-01-13 21:19 UTC Score 21.0 AI-113-20240113-social-media-a6e39316

Fitting a glmmTMB mode with pre-defined coefficients

I'm working on an analysis in which I conducted multimodel inference and model averaging using glmmTMB, which I used for the ordered beta distribution and I would like to stick with. I dredged the global model, took the 95% confidence set, and calculated the average coefficient for each predictor. Now, however, I would like to figure out how well this averaged model explains the data. Is there a way of making or fitting a model object with predefined coefficients? I would then use this in k-fold cross-validation, and/or in performance::r2, but either way I need a model object. Here is an example: data = data.frame(response = c(0.5, 0.2, 0.3, 0.6, 0.75), varA = c(0, 0.2, 0.4, 1, 0.8), varB = c(-0.4, -1.3, 0.3, 1.6, 0.8), varC = c(-1.2, -0.1, 0.5, 1.2, -0.3)) model Ultimately, I end up with a set of coefficients that are similar to, but different than, my global model. I thought about going into the global model object and manually overwriting the variable coefficients in the object (eg, model$fit$par[1] is the intercept, model$fit$par[2] is varA, and so on.) However, there are other parameters that I don't know how to obtain without refitting the model with the new averaged coefficients, one labelled "betad" and two labelled "psi". Could someone please suggest either a) how to fit the model using varA_coeff, varB_coeff, and varC_coeff, b) how to figure out "betad" and "psi" without refitting the model, or c) an alternative way to evaluate the fit of my averaged model?


AI Stack Exchange 2024-01-12 08:00 UTC Score 21.0 AI-110-20240112-social-media-9bd62ed3

publically available language models that can be used to train arbitrary language data?

I have sentence data in a language that is not widely in use and as such popular LLMs do not support the language. I want to train some language model such that given some question, it is able to respond back in the same language, just as in ChatGPT just with a different language. In such a case, what language model is publically available and is sufficiently powerful? Or would it be possible to use popular LLMs (such as ChatGPT) to achieve such a goal?

AI Stack Exchange 2024-01-07 09:52 UTC Score 15.0 AI-110-20240107-social-media-f675f662 Full article

How does one annotate overlapping objects in instance segmentation?

As I struggle to find any literature online about this, I wanted to ask about it here so that others could learn. My question is inspired by a Yolo GitHub issue . In this example we have 2 objects, here a plate and an egg, with one object being inside the other one. The question is how to annotate the plate (aka the outer object). Annotate full contour of outer object. Some pixels belong to 2 classes. Make a little bridge to the inner object so that the contour of the outer object excludes the inner object. This question arose while using Yolo but can be extended to other instance segmentation models. Any more information regarding good practices in instance segmentation is more than welcome.

Cross Validated 2023-12-30 02:56 UTC Score 24.0 AI-113-20231230-social-media-f4bec8e3

How does autoregressive training help limit compounding errors at inference?

I'm having a little trouble justifying something in my head and was hoping someone could provide some intuition? I understand for LSTM models or models that maintain some state about a sequence that training auto regressively makes sense to help a model learn to manage its context and states. What I am struggling with is if we used a model that did not maintain some hidden state. For this example lets say that we have some time series x and we apply an AR model to the series. Now say we replace the parameters of the AR model with multiple fully-connected layers. I believe training the model on one step ahead predictions and applying it to multi step would introduce compounding errors, but I cannot justify this intuitively to myself in my head. Could anyone shed light on this? I keep coming back to the idea that basically one step ahead training here is just like teacher forcing techniques for LSTMS. Any insight is much appreciated!

Cross Validated 2023-12-27 19:56 UTC Score 15.0 AI-113-20231227-social-media-6f6f94d2

Given an array of different non integer values, how do I find the value where 99% of the data is above and value where 99% is below

I can easily find the min and the max of the list by going through the list, But I can't seem to figure out how to get 99% of the min and 99% of the max. I need this mainly because there are some spikes in data and I want to draw it without those spikes I would think taking a weighted average of the entire distribution, then dividing by the weight*99 would give me the 1% location, and weight/99 would give me the 99% location. Is this correct? I am trying to solve the problem without sorting the array

Comment on State-Of-The-Art Approaches to Attribution in Marketing by Bay tech media
TOPBOTS 2023-12-27 18:30 UTC Score 26.0 AI-043-20231227-ai-specialis-074811ae Full article

Comment on State-Of-The-Art Approaches to Attribution in Marketing by Bay tech media

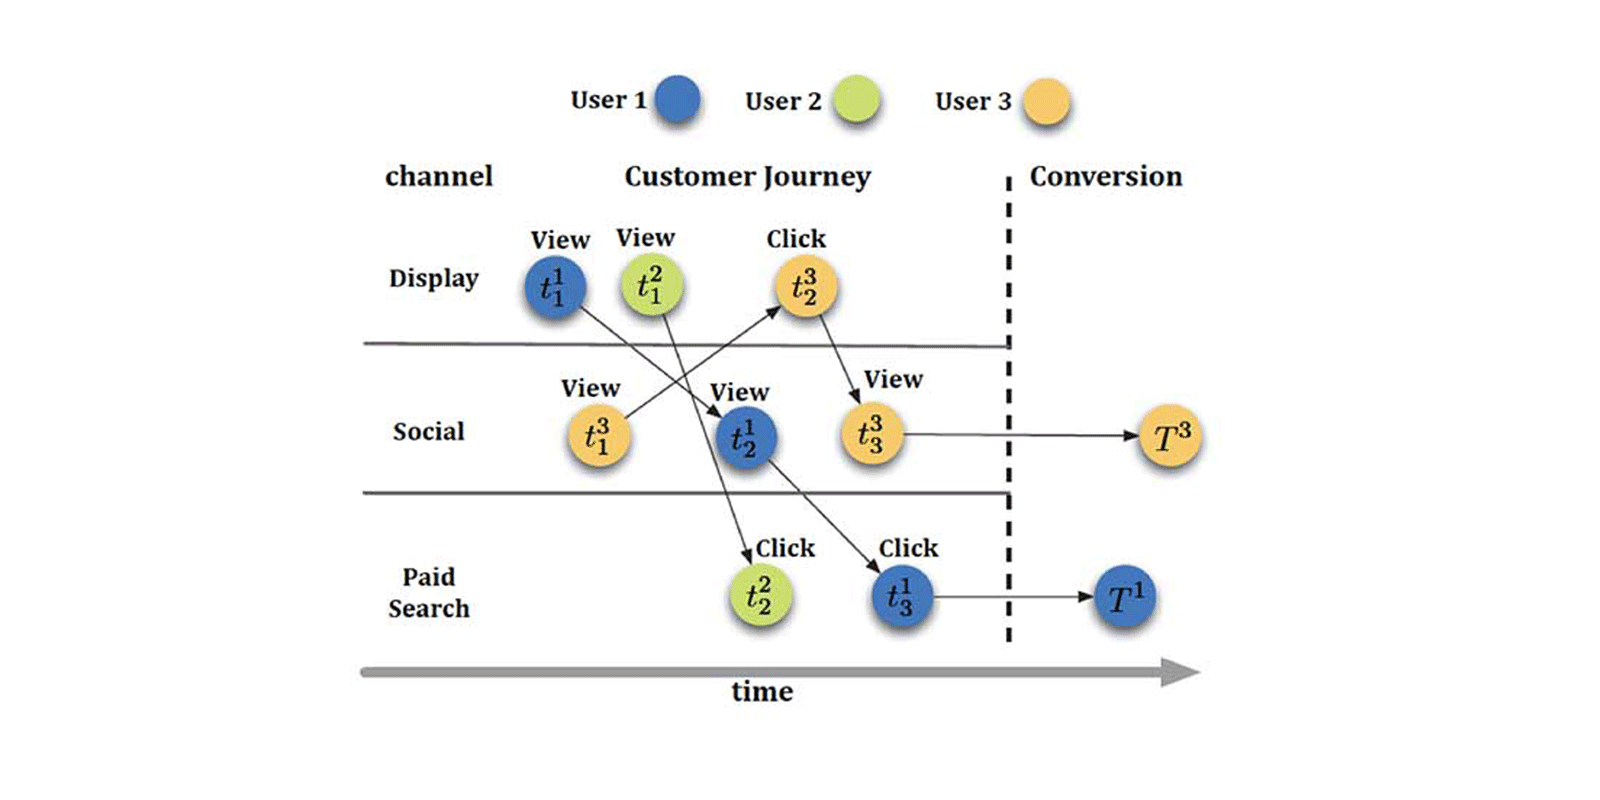
In the realm of digital marketing, attribution methodologies have undergone significant advancements. State-of-the-art approaches include Multi-Touch Attribution (MTA) for holistic channel tracking, Algorithmic Attribution leveraging machine learning for precise credit assignment, Cross-Device Attribution capturing interactions across devices, Incrementality Testing to gauge true marketing impact, and AI-Powered Attribution for deep data analysis. Bay Tech Media implements these cutting-edge methods, empowering businesses with accurate insights to refine and optimize their marketing strategies effectively.

Cross Validated 2023-12-26 16:55 UTC Score 21.0 AI-113-20231226-social-media-f9428b84

Causal Inference When Treatment and Outcome Are Aggregated At Different Levels

Consider a scenario where a treatment is a U.S. state-level policy (some states adopted the policy while others did not) and the outcome are individual-level responses to a survey across American states. To make this scenario less abstract, let's say that the policy is gun-reform legislation and the outcome is individual perceptions of safety. As a result, treatment and outcome are aggregated at different levels. Immediately, I can see an issue with this approach as it relates to identifying confounders to adjust for. For example, ideology seems like a clear confounder in this case, but ideology aggregated in what way? The ideological make-up of the state will impact the probability of adopting gun-reform legislation and the ideology of an individual will impact their perception of safety, but the ideology of a state and the ideology of an individual are two separate (but related) concepts. Also, if this is the case, is "ideology" even a confounder? Naively, I can say that: Gun Reform $\leftarrow$ Ideology $\rightarrow$ Safety Perception But this isn't really true, is it? Because, what I'm actually assuming are two separate measures of ideology entirely: Gun Reform $\leftarrow$ State's Ideological Makeup Safety Perception $\leftarrow$ Individual's Ideology How might one handle situations such as these, where problems seem to be driven solely by the different level of aggregation between treatment and outcome? One obvious course might be to average the responses of the outcom…

Canonical correlation analysis - loadings vs coefficients
Cross Validated 2023-12-19 13:35 UTC Score 12.0 AI-113-20231219-social-media-6d9bc241 Full article

Canonical correlation analysis - loadings vs coefficients

I'm trying to wrap my head around how to interpret the results of CCA. I've got a fairly deep understanding of OLS regression, and I've read a lot of helpful CCA explainers like this one by @ttnphns . However, I'm still struggling with one particular aspect of the logic of what one apparently does with the CCA results. I'll unpack below, using terminology from the R package CCA to refer to different elements. In particular, I understand that the math of CCA treats X and Y identically, i.e., this is correlation, not regression. But, in a situation where Y is logically downstream of X, and where Y comprises multiple theoretically independent outcomes, the idea of using the ycoef s, which are essentially regression coefficients specifying the linear combination of y s that produce a given yscore , and which, like OLS regression, reflect the joint influence of the given y and all the other y s , doesn't make sense to me. Again, I understand the math of how a given yscore is derived, and how that is reflected in the ycoef s. What I don't like is the idea of reporting how the various y s 'contributed to' constructing this synthetic latent variable in a regression sense, because in reality, all the y s arose independently—or, more in keeping with the logic of CCA, they were all driven by some set of latent variables. What makes sense to me would be to report the xcoef s alongside the corr.Y.yscores , that is, the coefficients for how each x relates to a given xscore , and the loadi…

Salmon in the Loop
The Gradient 2023-12-16 17:00 UTC Score 10.0 AI-037-20231216-ai-specialis-78cb7372 Full article

Salmon in the Loop

On fish counting – a complex sociotechnical problem in a field that is going through the process of digital transformation.

Cross Validated 2023-12-15 01:26 UTC Score 18.0 AI-113-20231215-social-media-83bd6b0b

Fixed-effect model with ridge regression, or how else to deal with multicollinearity

I am currently writing a registered report for data which will be clustered within eight countries. Since that is too few to do a multilevel model with random effects (McNeish & Stapleton, 2016), I've chosen a fixed effects approach, where the country clusters are modelled as fixed effects (dummy variables) and the standard error is is multiplied by the square root of the unconditional design effect (McNeish & Kelley, 2019; McNeish & Stapleton, 2016). I've already set up a Monte Carlo simulation to do a power analysis for such a model. However, one there is one problem. One analysis in my study will be to check for the effect of one variable while controlling for another variable, and there is reason to assume both would be correlated. Some degree of multicollinearity is of course fine, but I'm worried about what to do if it gets too substantial. I cannot drop one of the variables, since they both need to be there for theoretical reasons. In regular multiple regression models, a typical recommendation is ridge regression - but to do my fixed effects model, I would have to obtain p values by first multiplying the standard error with the square root of the unconditional design effect, and standard error estimates in penalised models seem to be an issue, with statistical software often not containing functions to obtain them because they wouldn't be very meaningful anyway. So, I'm a bit stuck on how to proceed here - do I use ridge regression and obtain the standard error estim…

Multiple linear regression with possibly non-independent explanatory variables
Cross Validated 2023-12-13 21:31 UTC Score 9.0 AI-113-20231213-social-media-09fba7d8 Full article

Multiple linear regression with possibly non-independent explanatory variables

For a given household for which I have many years of historical data, I want to predict the home gas consumption (heating) with a few variables among: date gas min_temp max_temp mean_temp relative_humidity absolute_humidity other_column 2023-01-01 5.8 m^3 -3.0°C 2.3°C -1.2°C 79 % 4 g/m^3 ... 2023-01-02 4.8 m^3 2.0°C 4.2°C 2.3°C 82 % 4.5 g/m^3 ... ... I could do a multiple linear regression for $$\rm{gas\ consumption} = \beta_0 + \beta_1 \rm{min\ temp} + \beta_2 \rm{max\ temp} + \beta_3 \rm{mean\ temp} + ... + \varepsilon,$$ but since many of these variables are not independent of each other (and maybe nearly collinear), doing a standard multiple linear regression might give bad results (for example with some negative $\beta_i$ where it shouldn't). Which better solution can we use? PCA + multiple linear regression (PCR) or PLS or something else? Note: I'd like to avoid using all 3 (min, max, mean) temp, if possible. How can we evaluate the loss if using using only 1 temperature variable (the best fit among the 3) instead of the 3 variables?

A new old kind of R&D lab
Fast.ai 2023-12-12 00:00 UTC Score 25.0 AI-185-20231212-developer-an-8e33d8a2 Full article

A new old kind of R&D lab

Answer.AI is a new kind of AI R&D lab which creates practical end-user products based on foundational research breakthroughs.

Cross Validated 2023-12-05 19:11 UTC Score 12.0 AI-113-20231205-social-media-761390cf

How do we decide the sample size we need for ensuring reliability for a test?

There is a test consisting of 6 questions and additional sub-Qs. The test was translated into another language and the questions were adapted, but the reliability of the test was never assessed. The test has an existing rubric and scoring, but only questions 2(a) and 2(c) were self-scored in the rubric as those items were added to the existing test. I have provided details about the scoring and the test questions below. MC stands for Multiple-choice OE stands for Open-ended. Item Parts Points 1 a (MC) 2 b (OE) 2 c (OE) 1 Item Parts Points 2 a (OE) 4 b (OE) 1 c (MC) 3 Item Parts Points 3 (MQ) 1 Item Parts Points 4 (MQ) 2 Item Parts Points 5 a (OE) 5 b (OE) 2 c (OE) 2 d (OE) 2 e (OE) 2 f (OE) 2 Item Parts Points 6 a (OE) 2 b (OE) 2 c (MC) 1 d (OE) 4 e (OE) 4 I have three questions: How many participants would I need to check the reliability of the test? If this test was applied to a group of 12 participants, how many of them would need to be checked for inter-reliability by another scorer? Since the rubric was self-scored for questions 2(a) and 2(c) as they were adapted/added, how can we ensure reliability?

Cross Validated 2023-12-04 02:09 UTC Score 9.0 AI-113-20231204-social-media-a48a5266

Repeated measures Ancova in R [closed]

I am trying to analyse my data but I am unsure if repeated measures ancova is the way to go. I have a variable named "A" measured in three different conditions "1", "2" and "3" (the sample size between groups is unequal). I also have a continues covariate measured just once in the first moment. My R code until now is: Rmancova I did try ezAnova in R but it didn't help me as it doesn't incorporate covariates yet.

Cross Validated 2023-12-03 19:56 UTC Score 12.0 AI-113-20231203-social-media-c04d9e16

How to interpret DCC GARCH alpha and beta (dcca1 and dccb1 in R)

I have just run a DCC GARCH model in R and am trying to interpret the output. I have run the model with 3 time series. I know that alpha and beta tell about the short- and long-term spillover effect. However, I only get one dcca1 and dccb1 even though the values of dcca1 and dccb1 should be different for the different time series. So what do dcca1 and dccb1 tell me?

Transformers: Cross Attention Tensor Shapes During Inference Mode
Cross Validated 2023-12-01 21:33 UTC Score 21.0 AI-113-20231201-social-media-26df2fd4 Full article

Transformers: Cross Attention Tensor Shapes During Inference Mode

Using the "classic" transformer model describing in "Attention is All You Need", I'm struggling to understand how the Encoder output is used by the Decoder during cross attention while in inference mode, specifically how the actual matrix multiplication can happen. During training mode, everything makes sense to me: The Encoder outputs a tensor of shape (B, T, C) where B = batch_size, T = max_tokens, and C = d_model = embedding dimension size. This is passed to the Decoder and changed to shape (B, T, T) through the scaled dot product mechanism (will call this tensor A ) A is multiplied by the Decoder's value tensor of shape (B, T, HS) where HS = depth = head size. This multiplication is possible because the shapes of the tensors comply (B, T, T) @ (B, T, HS) --> (B, T, HS) . But in inference mode we start with a Decoder value tensor that will only have a token length of 1 , so a tensor shape of (1, 1, HS) , where T != 1, and then expand the sequence from there. So, during the cross attention step with the Encoder, how can A with shape (1, T, T) be multiplied with (1, 1, HS) ? Clearly, I'm missing something pretty big here, so any help would be much appreciated!

Cross Validated 2023-11-29 11:54 UTC Score 9.0 AI-113-20231129-social-media-68d4cd5f

how can I evaluate the unbalanced data set

The output here shows the titles and descriptions of the comments written for the evaluation of the top 100 books in amazon with nltk vader, and the total reviewer rating for those analyzes, but there is an imbalance between reviewer rating how can I statistically make sense of the data here 1 : https://i.sstatic.net/2N5Cv.png custrew[["reviewer rating","title sentiment result","desc sentiment result"]] \ .groupby(["title sentiment result","desc sentiment result"]).sum() code of output def duygu_analizi(text): sentiment = analyzer.polarity_scores(text) if sentiment['compound'] >= 0.05: return 'Pozitif' elif sentiment['compound'] example code for title sentiment result also my data (ı dont show another columns because no necessary): my goal is just define a relationship between title/description sentiement analysis and reviewer rating. when sentiment is positive, are reviewer ratings be positive too? or When sentiments are intense, does your rating also tend to be high? ı have two distinct variable for title sentiment and description sentiment

Cross Validated 2023-11-28 14:57 UTC Score 12.0 AI-113-20231128-social-media-b2657f4d

How should I analyze my Likert scale data?

I am a high schooler conducting a survey on a group of 20 other high schoolers. They will take a 10 item pretest questionnaire containing 9 5-point Likert scale questions and 1 short-answer response question before viewing a film. After screening is complete, they will take the same questionnaire (labeled posttest just to make analysis easier) again. I am trying to find a way to identify and interpret differences in participants' responses to the Likert scale questions between the pretest and posttest questionnaire. I am looking to analyze the Likert scale questions as quantitative data, but I am unsure of how to do this and what software to use.

Cross Validated 2023-11-27 21:44 UTC Score 20.0 AI-113-20231127-social-media-10bf745a

Correlations between cousins when many individuals are part of several cousin pairs

I have a data set with thousands of pairs of cousins. There is a row for each cousin pair, with two columns: One column for the test score of one of the cousins in the pair, and one column with the test score of the other cousin. I want to calculate the correlation between cousins on this test. I could then just correlate the two columns. But I then worry that there would be problems related to the fact that many individuals have several different cousins, so that they are part of many of the rows in the data. Am I right to worry about this? What are the specific problems that can follow from this? And what are some more appropriate ways to calculate the correlation, which are computationally feasible for a dataset with hundreds of thousands of rows? (I'm hopeful that there are ways that do not involve dropping rows from the data until every individual are part of only one pair)

Outlier Detection and Removal
Cross Validated 2023-11-27 17:11 UTC Score 15.0 AI-113-20231127-social-media-a4a976c9 Full article

Outlier Detection and Removal

I am reading a paper on wind power forecasting and the authors present a plot of the data before outliers are removed and a plot after. However, they don't actually say what method was employed to remove the outliers. I was hoping someone might offer some guesses or hints on how one would go about obtaining plot (b) from plot (a). Edit The paper is here: One-Day-Ahead Hourly Wind Power Forecasting Using Optimized Ensemble Prediction Methods by Chao-Ming Huang 1, Shin-Ju Chen, Sung-Pei Yang and Hsin-Jen Chen

Cross Validated 2023-11-27 16:14 UTC Score 15.0 AI-113-20231127-social-media-f7745750

Correlation structure for covariate variables in longitudinal regression

In longitudinal regression(ex: repeated measures for different people), we have the option to choose a correlation structure for the response variable. For example ( https://youtu.be/qoqhPq_VILc?si=yJmlrWR4hlgOz1IL ): But is it ever possible to have these kinds of correlation structures for the independent variables? I suspect that in many scenarios, the independent variables (covariates) are also correlated for the same subject from measurement to measurement. For example, in geriatric overweight patients, the patient weight (kilograms) almost always increases from measurement to measurement for the same patient (ie correlated). Thus, for the same patient, the weight variable is not IID .... which can be a violation of assumptions. Is there any modelling approach I can use for longitudinal regression (repeated measures) when I suspect that the independent variables have some correlation? Can I specify a correlation structure as well?

Comment on Step-By-Step Implementation of GANs on Custom Image Data in PyTorch: Part 2 by Mel Dorn
TOPBOTS 2023-11-18 08:21 UTC Score 12.0 AI-043-20231118-ai-specialis-4220f1d6 Full article

Comment on Step-By-Step Implementation of GANs on Custom Image Data in PyTorch: Part 2 by Mel Dorn

You got my attention. Learning Image Data and its role very interesting for me. As a photographer, I am constantly looking for information that can help grow my professionalism. I also couldn’t ignore this article offers valuable insights into perfecting nature photography, enhancing my appreciation for this art form.

Cross Validated 2023-11-14 21:29 UTC Score 12.0 AI-113-20231114-social-media-a95aa457

Best way to set-up a linear mixed model analysis for medical device bench data?

I am working on a bench study comparing two commercial devices (Device X and Device Y) and their ability to hold contact force over 30 seconds on a substrate at 2 independent angles (16 and 130). This will be done on fresh devices and after multiple articulations (0, 50, 100, and 120). The more articulations = device fatigue, so predicting it can reduce contact force stability (i.e. more variability). The output we are looking at is 'mean contact force' (over 30 seconds) and any variability. Since these samples are not independent, I anticipate the need for a linear mixed model analysis. Any preference of using GraphPad or R. If R, how would I establish the initial lmm equation with the multiple levels?

AI Stack Exchange 2023-11-14 14:24 UTC Score 21.0 AI-110-20231114-social-media-a6b177fa

How can we construct a skewed noise distribution using the maximum likelihood approach?

When the probability of observing a large positive error is larger than the probability of observing a large negative error in binary classification, how can this be modelled by a skewed noise distribution using the maximum likelihood approach? The content is as follows: From page 103 of: http://smlbook.org/book/sml-book-draft-latest.pdf "Using the maximum likelihood approach, other assumptions about the noise or insights into its distribution can be incorporated in a similar way in the regression model (5.1). For instance, if we believe that the error is non-symmetric, in the sense that the probability of observing a large positive error is larger than the probability of observing a large negative error, then this can be modelled by a skewed noise distribution. Using the negative log-likelihood loss is then a systematic way of incorporating this skewness into the training objective."

Cross Validated 2023-11-11 20:54 UTC Score 23.0 AI-113-20231111-social-media-109b5ebc

Testing difference between datasets from binomial distributions

We will be conducting an experiment where a group of $N$ people take a test that has $M$ independent yes-no questions. We compute the number of questions each person $j$ gets correct as a score $m_j$ . It seems reasonable to model the score as a binomial random variable $m_j\sim B(n=M, p=p_j)$ . However, we have no prior knowledge about $p_j$ , and since the test requires skill, it seems that $p_j$ could vary from one person to the next. Question 1: Is it reasonable to use the average score over the population, $m^* = \frac{1}{N}\sum_1^N m_j$ , as the value of $p_j$ for all $j$ ? Thus, we model each of the $N$ scores as a draw from the same distribution $B(n=M, p=m^*)$ . Then, say we repeat the experiment on a new group of $N$ people with a different test (still $M$ independent yes-no questions). We would like to know if the performance on the second test is better than on the first. Question 2: What is the best way to determine if the second population had better scores than the first? Does the answer to Q2 change if we can or cannot model each population as coming from $B(n=M, p=m^{\ast})$ with different $m^{\ast}$ as in Q1. I have considered using a one-sided Welch's t-test on the populations of scores $m_j$ to determine if the average score $m^\ast$ is different between experiment 1 and 2 -- the null hypothesis is that $m^\ast$ is the same for the two experiments, and if we reject the null hypothesis then we can say the second population performed better. The data is unp…

LatAm Journalism Review AI 2023-11-06 18:27 UTC Score 18.0 AI-176-20231106-regional-ai--5c9429fc Full article

Gabo Foundation to host master class in Spanish on AI opportunities for investigative journalism

"The Gabo Foundation invites to a master class with journalist Emilia Díaz-Struck, executive director of the Global Investigative Journalism Network (GIJN), on Nov. 8. Díaz-Struck will explore artificial intelligence (AI) opportunities for investigative journalism, the editorial processes related to data management and advanced technology, as well as reporting and fact-checking. Challenges and risks related to […] The post Gabo Foundation to host master class in Spanish on AI opportunities for investigative journalism appeared first on LatAm Journalism Review by the Knight Center .

LatAm Journalism Review AI 2023-11-06 18:27 UTC Score 18.0 AI-176-20231106-regional-ai--322624c9 Full article

Gabo Foundation to host master class in Spanish on AI opportunities for investigative journalism

"The Gabo Foundation invites to a master class with journalist Emilia Díaz-Struck, executive director of the Global Investigative Journalism Network (GIJN), on Nov. 8. Díaz-Struck will explore artificial intelligence (AI) opportunities for investigative journalism, the editorial processes related to data management and advanced technology, as well as reporting and fact-checking. Challenges and risks related to […] The post Gabo Foundation to host master class in Spanish on AI opportunities for investigative journalism appeared first on LatAm Journalism Review by the Knight Center .

AI Stack Exchange 2023-11-05 20:04 UTC Score 15.0 AI-110-20231105-social-media-7871d065

An Adaline neuron can solve problems that are not linearly separable?

https://en.wikipedia.org/wiki/ADALINE I was confused about this because, for example, the XOR problem is not linearly separable, and a simple Perceptron obviously cannot solve it, so we would need a network like the multilayer perceptron. Furthermore, some sources on the internet say that Adaline's learning algorithm, the LMS (Least Mean Squares) algorithm, converges to the minimum error assumption, regardless of whether the training data is linearly separable or not . However, this refers to minimizing MSE, not correctly classifying all training samples. But this leaves me confused. What does that mean? An Adaline neuron can solve problems that are not linearly separable ? If so, what is the difference between Adaline's ability to solve problems that are not linearly separable and other neural networks such as Madaline and multilayer perceptron?

Cross Validated 2023-11-04 17:46 UTC Score 12.0 AI-113-20231104-social-media-daad025a

Method of least squares, first order condition and QR decomposition

When you use the method of least squares you estimate the parameters in the following way: $$\min_{\mathbf{b}} (\mathbf{y} - \mathbf{X}\mathbf{b})^T(\mathbf{y} - \mathbf{X}\mathbf{b})$$ Where $\mathbf{y}_{n \times 1}$ , $\mathbf{X}_{n \times (p + 1)}$ and $\mathbf{b}_{(p+1) \times 1}$ If you solve the problem you obtain the following first order condition: $$\mathbf{X}^T\mathbf{X}\mathbf{b} = \mathbf{X}^T\mathbf{y}$$ According to R version 4.3.1 to find $\mathbf{b}$ QR decomposition is used (see ?lm in relation to method = "qr" ). Thefore we have that if $\mathbf{X}$ is of full column rank it can be expressed as $\mathbf{X} = \mathbf{QR}$ where $\mathbf{Q}$ is a orthogonal matrix with dimensions $n \times (p+1)$ and $\mathbf{R}$ is a upper triangular matrix with dimensions $(p + 1) \times (p + 1)$ . According to wikipedia ( here , here and here ) we have the following: $\mathbf{Q}\mathbf{Q}^T = \mathbf{Q}^T\mathbf{Q} = \mathbf{I}$ For $\mathbf{R}$ we have that $r_{ij} = 0$ for $i > j$ Then applying this to the first order condition we have that: $$\mathbf{X}^T\mathbf{X}\mathbf{b} = \mathbf{X}^T\mathbf{y}$$ $$(\mathbf{QR})^T\mathbf{QR}\mathbf{b} = (\mathbf{QR})^T\mathbf{y}$$ $$\mathbf{R}^T\mathbf{Q}^T\mathbf{QR}\mathbf{b} = \mathbf{R}^T\mathbf{Q}^T\mathbf{y}$$ $$\mathbf{Q}^T\mathbf{QR}\mathbf{b} = \mathbf{Q}^T\mathbf{y}$$ $$\mathbf{Rb} = \mathbf{Q}^T\mathbf{y}$$ $$\mathbf{b} = \mathbf{R}^{-1}\mathbf{Q}^T\mathbf{y}$$ Using the following reproducible example you can see that th…

Comparing the change in proportions across two time periods for two groups
Cross Validated 2023-11-02 14:56 UTC Score 9.0 AI-113-20231102-social-media-eb3b3d0a Full article

Comparing the change in proportions across two time periods for two groups

I am running a test across two groups over a period of time and want to understand if the Change in proportions for my test group is significantly different to the change in proportions in the control group. Most of what I have found compares one proportion to another either over group or over time but not both. If I have: my Test group with proportions P1 and P2 with sample N1 and N2 (in periods T1 and T2) my control group with proportions Q1 and Q2 with sample M1 and N2 (in periods T1 and T2) I want to know if P2-P1 is statistically significantly different to Q2-Q1 P1,P2,Q1, Q2 are all percentages. Any help would be most appreciated!

Anyscale Blog 2023-11-01 00:00 UTC Score 38.0 USR-0085-20231101-ai-specialis-1603991d

Reproducible Performance Metrics for LLM inference

Update June 2024: Anyscale Endpoints (Anyscale's LLM API Offering) and Private Endpoints (self-hosted LLMs) are now available as part of the Anyscale Platform. Click [here](https://console.anyscale.com/?utm_source=anyscale&utm_medium=blog&utm_campaign=blog_callout&utm_content=june2024_product_update_subheading) to get started on the Anyscale platform.

Lilian Weng Blog 2023-10-25 00:00 UTC Score 48.0 USR-0112-20231025-ai-specialis-81866df8 Full article

Adversarial Attacks on LLMs

The use of large language models in the real world has strongly accelerated by the launch of ChatGPT. We (including my team at OpenAI, shoutout to them) have invested a lot of effort to build default safe behavior into the model during the alignment process (e.g. via RLHF ). However, adversarial attacks or jailbreak prompts could potentially trigger the model to output something undesired. A large body of ground work on adversarial attacks is on images, and differently it operates in the continuous, high-dimensional space. Attacks for discrete data like text have been considered to be a lot more challenging, due to lack of direct gradient signals. My past post on Controllable Text Generation is quite relevant to this topic, as attacking LLMs is essentially to control the model to output a certain type of (unsafe) content.

UN AI Advisory Body 2023-10-24 16:36 UTC Score 29.0 USR-0162-20231024-company-offi-f2b8419b Full article

Third United Nations Conference on Landlocked Developing Countries (LLDC3)

Third UN Conference on Landlocked Developing Countries Awaza, Turkmenistan 5-8 August 2025 Driving Progress through partnerships The United Nations General Assembly (UNGA) decided to convene the Third United Nations Conference on Landlocked Developing Countries (LLDC3) from 5-8 August in Awaza, Turkmenistan at the highest possible level, including Heads of State and Government, on the theme “Driving progress through partnerships”. Stakeholder Participation in the Conference: As guided by resolution A/RES/77/246 , other relevant stakeholders, including the non-governmental organizations, civil society organizations, academic institutions and the private sector whose work is relevant to the Conference are invited to participate as observers in the Conference and its preparatory meeting. For additional information, please visit the Conference website: 3rd UN Conference on Landlocked Developing Countries (LLDC3) Relevant stakeholders who have received special accreditation to any of the conferences and summits listed below (check the consolidated list here ) may participate in the conference by following the REGISTER NOW link here . The registration deadline is 12 July 2025. The Global Conference on the Sustainable Development of Small Island Developing States The International Meeting to Review the Implementation of the Programme of Action for the Sustainable Development of Small Island Developing States The third International Conference on Small Island Developing States The f…

AI Stack Exchange 2023-10-17 22:05 UTC Score 12.0 AI-110-20231017-social-media-ea851c9d

Unclear points in scaled Euclidean distance

The following is from a machine learning book. I did not understand the explanation given in the figure caption. Could some expert make it clear? Why is the stretching class-dependent for the center case?

Neural algorithmic reasoning
The Gradient 2023-10-14 15:30 UTC Score 13.0 AI-037-20231014-ai-specialis-f4364e5c Full article

Neural algorithmic reasoning

In this article, we will talk about classical computation : the kind of computation typically found in an undergraduate Computer Science course on Algorithms and Data Structures [1]. Think shortest path-finding, sorting, clever ways to break problems down into simpler problems, incredible ways to organise data for efficient retrieval and updates.

Loading Llama-2 70b 20x faster
Anyscale Blog 2023-10-11 00:00 UTC Score 39.0 USR-0085-20231011-ai-specialis-2a4bfb21 Full article

Loading Llama-2 70b 20x faster

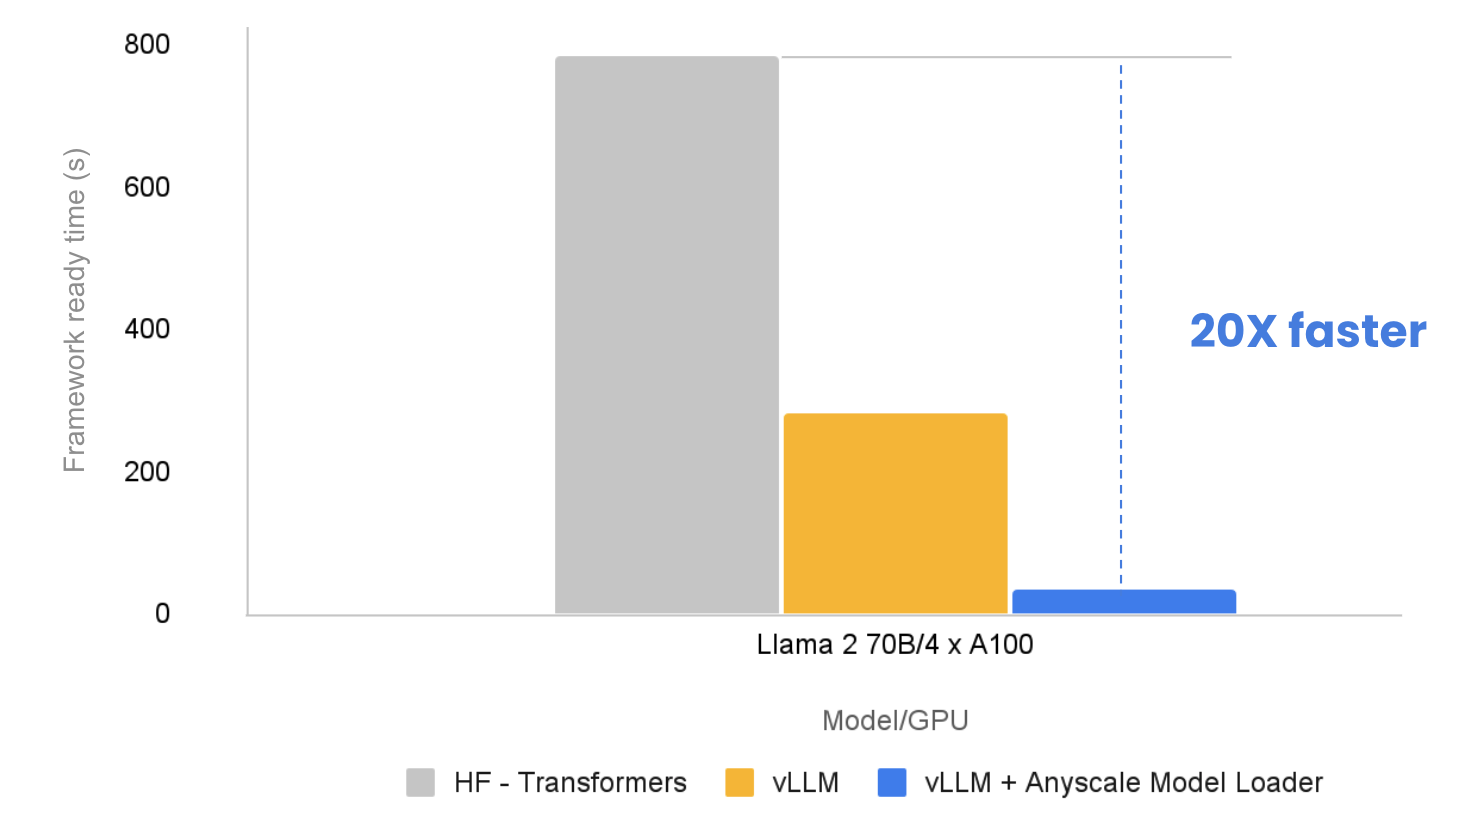
In this post, we discuss the importance of speed when loading large language models and what techniques we employed to make it 20x faster. In particular, we use the Llama 2 series of models. We share how you can reduce latency and costs using the Anyscale platform.

Chip Huyen Blog 2023-10-10 00:00 UTC Score 53.0 USR-0111-20231010-ai-specialis-f4a68771 Full article

Multimodality and Large Multimodal Models (LMMs)

For a long time, each ML model operated in one data mode – text (translation, language modeling), image (object detection, image classification), or audio (speech recognition). However, natural intelligence is not limited to just a single modality. Humans can read, talk, and see. We listen to music to relax and watch out for strange noises to detect danger. Being able to work with multimodal data is essential for us or any AI to operate in the real world. OpenAI noted in their GPT-4V system card that “ incorporating additional modalities (such as image inputs) into LLMs is viewed by some as a key frontier in AI research and development .” Incorporating additional modalities to LLMs (Large Language Models) creates LMMs (Large Multimodal Models). Not all multimodal systems are LMMs. For example, text-to-image models like Midjourney, Stable Diffusion, and Dall-E are multimodal but don’t have a language model component. Multimodal can mean one or more of the following: Input and output are of different modalities (e.g. text-to-image, image-to-text) Inputs are multimodal (e.g. a system that can process both text and images) Outputs are multimodal (e.g. a system that can generate both text and images) This post covers multimodal systems in general, including LMMs. It consists of 3 parts. Part 1 covers the context for multimodality, including why multimodal, different data modalities, and types of multimodal tasks. Part 2 discusses the fundamentals of a multimodal system, using the…

How to deal with a Stationary DV and a Trend-Stationary IV in using OLS?
Cross Validated 2023-10-08 04:39 UTC Score 9.0 AI-113-20231008-social-media-de1e9c72 Full article

How to deal with a Stationary DV and a Trend-Stationary IV in using OLS?

I have a dependent variable that is stationary in levels. However, one of the IVs is only trend-stationary (stationary around a deterministic trend that I can extract from the series). In other words, I have a regression with variables that have different transformations. My question is, does this bias the significance of the results, including the significance of any other IVs (that are stationary in levels in the regression)? If not, it is probably reasonable to assume that it biases the estimated coefficient of the DP on the trend-stationary IV but not the significance of the effect since it shouldn't impact the standard errors (due to the trend being deterministic). Is that an accurate assessment? Also, what if I detrend (i.e. extract a deterministic trend) from my stationary DV? Is this equivalent to over differencing and thus losing important information from the series? Does extracting a deterministic trend from a stationary series even make sense?