AI/ML News & Innovations Hub

AI/ML news, top picks, and generated innovation digests.

★ Visit ai-karthik.com
422Sources
40179News Items
8Top Picks
238Blogs
successLast Run

Latest AI/ML News

40179 matching items

Qdrant Blog 2024-04-10 00:02 UTC Score 36.0 USR-0074-20240410-ai-specialis-be8aff50 Full article

Qdrant Hybrid Cloud and Haystack for Enterprise RAG

We’re excited to share that Qdrant and Haystack are continuing to expand their seamless integration to the new Qdrant Hybrid Cloud offering, allowing developers to deploy a managed vector database in their own environment of choice. Earlier this year, both Qdrant and Haystack, started to address their user’s growing need for production-ready retrieval-augmented-generation (RAG) deployments. The ability to build and deploy AI apps anywhere now allows for complete data sovereignty and control. This gives large enterprise customers the peace of mind they need before they expand AI functionalities throughout their operations.

Qdrant Blog 2024-04-10 00:00 UTC Score 35.0 USR-0074-20240410-ai-specialis-abf36617 Full article

Elevate Your Data With Airbyte and Qdrant Hybrid Cloud

In their mission to support large-scale AI innovation, Airbyte and Qdrant are collaborating on the launch of Qdrant’s new offering - Qdrant Hybrid Cloud . This collaboration allows users to leverage the synergistic capabilities of both Airbyte and Qdrant within a private infrastructure. Qdrant’s new offering represents the first managed vector database that can be deployed in any environment. Businesses optimizing their data infrastructure with Airbyte are now able to host a vector database either on premise, or on a public cloud of their choice - while still reaping the benefits of a managed database product.

Treat left missing values as void in sequence analysis
Cross Validated 2024-04-09 19:35 UTC Score 12.0 AI-113-20240409-social-media-55a918c5 Full article

Treat left missing values as void in sequence analysis

I am doing sequence analysis using Traminer and I have employment sequences from age 51 to age 75. However, because some participants enter the survey after age 51, some of the sequences start later (left missing values). I also have some right missing, and some internal missing gaps. I would like to treat internal missing gaps as an additional state, and left and right gaps as voids. However, if I set the option "DEL" for left missing values, the sequences get shifted to the left and the voids appear to the right. Do you have any advice on how to treat left missing gaps so that they are set as void without shifting the sequences? I am afraid shifting sequences would distort timing too much when using the indel costs. Here is my code: States_Wide.seq

Cross Validated 2024-04-02 07:17 UTC Score 20.0 AI-113-20240402-social-media-1024f83c Full article

Apply a method for competing risks with the propensity score IPTW weights

I have a data in which I have to apply a competing risk. 4 variables: Temps_Competing_Descompensacio: the time to event. Competing_Descompensacio: factor variable to identifie the event, censored, event or competing event. Grup_IQ: stratified analisis (2 groups). IPTW: the weights of the observation from a previous propensity score phase. My problem is to apply a method for competing risks with the propensity score IPTW weights. I haven't found a way to do it. The analysis without the weights was correct. Already tested and compared with a SAS sintax. Here my code from the for the crr function from the cmprsk package fit.crr $Temps_Competing_Descompensacio, fstatus = Competing_dataset$ Competing_Descompensacio, cov1 = Competing_dataset$Grup_IQ, failcode = 1, cencode = 0) The issue comes when I try to add the weights, as I do not see or find an argument to ponderate the results. I considered multiplying the time variables for the weights, but does not seem correct from methodolgy perspective, and I haven't found a solution from other libraries.

AI Stack Exchange 2024-03-31 11:39 UTC Score 15.0 AI-110-20240331-social-media-b51592ca

Time complexity of BFS in O(b^n) - Constant of Big-O-Notation?

Section 3.4.1 (Breadth-first search) of the book "Artificial Intelligence: A Modern Approach" (4th edition, by Norvig and Russell) estimates the total number of generated nodes for time complexity analysis as follows: $$ 1+b+\dots + b^d = O(b^d) $$ I understand how the term on the left side of the equation is obtained. However, while it seems intuitive that this expression is indeed in $O(b^d)$ , I am interested in a formal argumentation using the definition of Big-O-Notation. Hence, I want to find a constant $k$ for which the following holds: $$ 1+b+\dots + b^d \leq k * b^d $$ I would have simplified the left side as follows, using the formula for partial sums of a geometric series for $b \neq 1$ : $$ 1 * \left(\frac{b^{d+1}-1}{d-1}\right) \leq k * b^d $$ Then, I end up with the following expression: $$ b^{d+1} - 1 \leq k * b^{d+1} - k * b^{d} $$ However, I am unsure how I would proceed from here in order to estimate the constant $k$ .

AI Stack Exchange 2024-03-28 23:56 UTC Score 18.0 AI-110-20240328-social-media-874e1815

How do Energy Based Models solve Multiple possible outputs given one input

I've been looking into Energy Based Models recently which Yann LeCun has been strongly advocating for. One problem that he lists with probabilistic based models is that in the case when there are multiple possible outputs for one given input, the probabilistic model will return the Expected Value of the possible outputs. An example is if a model is given the task of completing a video of soccer ball being kicked, the possible output videos could have the ball going left, straight, or right. All our possible outputs. However many models will just return the expected value which means the output will be a really noisy blurred image which makes sense. My Question is how do Energy Based Models solve this problem. What example architecture is there that would solve this and why is this so.

AI Stack Exchange 2024-03-28 12:20 UTC Score 18.0 AI-110-20240328-social-media-3d64cebf

How do I input multi-channel Numpy array to U-net for semantic segmentation

I had lidar 3D point cloud data from semantckitti. I want to perform Semantic Segmentation on the data using U-Net. I converted the 3d point cloud data into 2D using spherical conversion and saved the original point cloud data which was in (.bin format) into numpy arrays with dimensions as 64,1024,5 where: 64 = height , 1024 = width and 5 = xyz coordinates, Intensity and Distance from sensor of each point, in that order. I also projected the semantic information contained in the label files of point cloud(taken from yaml file of semantickitti), on 2D image plane and saved them in .png format with each pixel having depitcing the color of its respective class. MY QUESTION IS: I have the multichannel numpy arrays with dimensions (64,1024,5) ,label images in .png format with dimensions (64,1024) as the input data for purposes of Training,validation and testing. How can i input this data in U-Net? Can i input the numpy array with (64,1024,5) directly in U-Net? or some processing needs to take place? Also do i need to perform one-hot encoding to my ground truth label images as they donot contain any additional information at the moment.

AI Stack Exchange 2024-03-28 03:35 UTC Score 20.0 AI-110-20240328-social-media-75905376

Trying to understand some derivation in the paper: Deep Unsupervised Learning using Nonequilibrium Thermodynamics

I have recently been learning about diffusion models and trying to derive all the results in the paper by Sohl-Dickstein, et. al, "Deep Unsupervised Learning using Nonequilibrium Thermodynamics" (2015): https://arxiv.org/pdf/1503.03585.pdf In the Appendix B of this paper, they define the log-likelihood lower bound term as, $$K = \int{dx^{(0...T)}} q(x^{(0...T)}) \text{log} \Bigg[p(x^{(T)}) \prod_{t=1}^{T} \frac{p(x^{(t-1)}|x^{(t)})}{q(x^{(t)}|x^{(t-1)})} \Bigg]$$ . They further try to isolate the $p(x^{(T)})$ in the square bracket. The next step of the calculation should be, $$K = \int{dx^{(0...T)}} q(x^{(0...T)}) \text{log} \sum_{t=1}^{T}\Bigg[ \frac{p(x^{(t-1)}|x^{(t)})}{q(x^{(t)}|x^{(t-1)})} \Bigg] + \int{dx^{(0...T)}} q(x^{(0...T)}) \text{ log } p(x^{(T)})$$ The first integral above looks the same as the first term in the paper, I am trying to make the second integral above go to $$\int dx^{(T)} q(x^{(T)}) \text{ log } p(x^{(T)})$$ For this, I am using the fact that $q(x^{(0...T)})$ can be written as, $$q(x^{(0...T)}) = q(x^{(0)}) \prod_{t=1}^{T} q(x^{(t)}|x^{(t-1)})$$ Then I am writing the second integral above as, $$\int{dx^{(0...T)}} q(x^{(0...T)}) \text{ log } p(x^{(T)}) \\= \int dx^{(0)} q(x^{(0)}) \int dx^{(1)}q(x^{(1)}|x^{(0)}) \ldots \int dx^{(T-1)}q(x^{(T-1)}|x^{(T-2)}) \int dx^{(T)}q(x^{(T)}|x^{(T-1)}) \text{ log } p(x^{(T)}) \\ = \int dx^{(0)} q(x^{(0)}) \Bigg(\prod_{t=1}^{T-1} \int dx^{(t)}q(x^{(t)}|x^{(t-1)}) \Bigg) \int dx^{(T)}q(x^{(T)}|x^{(T-1)}) \text{ l…

Mamba Explained
The Gradient 2024-03-28 01:24 UTC Score 19.0 AI-037-20240328-ai-specialis-b86db9e2 Full article

Mamba Explained

Is Attention all you need? Mamba, a novel AI model based on State Space Models (SSMs), emerges as a formidable alternative to the widely used Transformer models, addressing their inefficiency in processing long sequences.

AI Stack Exchange 2024-03-25 23:38 UTC Score 9.0 AI-110-20240325-social-media-d0e0f803

How to remove random noise from an image (denoising)?

When adding noise to an image, for instance, is the noise added evenly random (equally likely values within some range), or random but following some distribution (like the normal distribution)? Then, since the noise occurrence is intrinsically random at every pixel, how is it possible for any network to "predict" what the noise value at every pixel had been, in order to subtract it and get back the noiseless image?

AI Stack Exchange 2024-03-20 12:46 UTC Score 14.0 AI-110-20240320-social-media-394192fb

Best way to create a summary of variable length set of vectors where order does not matter

I'm trying to design a system to optimize over a variable-length set (like a sentence) of variable length vectors (like words). But unlike a sentence, the order of words does not matter . I'll have to make vector embeddings for my input vectors, so far is clear. And I'm familiar with RNN's power to make summaries of sentences and I'd like to make a summary of my set as well. The question is what tool is the best for this problem. Is there an alternative to RNN that can make a better summary of a variable-length set of embeddings? What is the best way to make a summary for my set?

AI Stack Exchange 2024-03-20 08:01 UTC Score 10.0 AI-110-20240320-social-media-cf3b6311

Total loss in backpropagation

I'd say I have some understanding of backpropagation, however I am not really sure of the total loss being calculated. Let us take the example below : After 1 forward pass when I have to update the parameters, I basically have to find answers to the question - What is the change in loss with respect to the change in a certain parameter i.e. if I were to update parameter w5 then, I need to calculate $$ \frac{\partial L}{\partial w_5} = \frac{\partial L}{\partial o_1} \cdot \frac{\partial o_1}{\partial w_5} $$ So how does the total loss that I calculated after a forward pass even matter? Is it simply for logging(keeping track of)? Another doubt that I have is: What exactly is this graph indicating? If it is the Loss value for different set of parameter values, then shouldn't it be a discrete function?

Cross Validated 2024-03-19 23:46 UTC Score 12.0 AI-113-20240319-social-media-189c2472

How should I visualise uncertainty in a histogram from survey sampling?

I have a numeric variable $\{x_i\}$ , which corresponding weights $\{w_i\}$ , where the weights are survey weights from a corresponding complex survey design. I want to visualise a weighted histogram of $\{x_i\}$ that also communicates the uncertainty on $\{x_i\}$ due to sampling error. What are some good ways to communicate this uncertainty? (I know how to make the weighted histogram, it's the uncertainty that I would like assistance with). If code answers are supplied, in R would be preferable. Note 1: In the past, I have created a histogram with error intervals (standard error) on the height of each histogram bar. But that seems clunky to me, and I was hoping to find out about other statistical visualisation techniques. Note 2: For the sake of making visualisation examples, feel free to just make up uncertainties/errors. I will calculate them in my own project using jack-knife replicate weights.

Cross Validated 2024-03-16 15:09 UTC Score 12.0 AI-113-20240316-social-media-fe388650

How do I interpret this QQ plot and residual vs fitted plot?

I have a model in R looking at infectious disease spread on social networks, and I am running into a problem where my data are clearly not normally-distributed when I try to run a linear regression but I'm unsure of how to approach it. My dependent variable/outcomes are maximum prevalence, time of peak infection, length of outbreak, cumulative infection, and maximum Reff. My independent variables are homophily based on SES, homophily based on health behavior, probability of isolation, and length of isolation. The model is simulation based and I end up with 1000 data points. I have some plots attached here using just the dependent variable of maximum prevalence, because the plots for all the outcomes look similar (from top left to right, then to the bottom row): histogram of my outcome, outcome vs residuals, histogram of residuals, fitted values vs residuals, QQ plot, and density of residuals. I have pretty limited statistical knowledge so I'm unsure of the best next step to approach this. HEAVY right skew based on the histograms but... (see point 3) Residuals are dependent on the outcome; I'm thinking I'm not using the right distribution for this analysis (I used a normal distribution for these); is there a way to diagnose what the correct distribution would be? QQ plot looks to me like it's indicating a heavy right skew, but log-transforming the data doesn't make anything look much better, including adjusted model R^2 and the QQ plot (see below) My only guess is that I'm us…

AI Stack Exchange 2024-03-15 10:27 UTC Score 15.0 AI-110-20240315-social-media-03535e7a Full article

Multi-task objective sometimes improve single-task performance, but is this true when fine tuning?

It is known that multitask objectives in neural networks sometimes have the effect of improving the performance of the neural network for each of the tasks individually (versus training the same network for each task individually). To what extent is this true when fine tuning a pretrained, single-task neural network to deal with a multi-task objectives versus training from scratch?

Chip Huyen Blog 2024-03-14 00:00 UTC Score 52.0 USR-0111-20240314-ai-specialis-b85052b1 Full article

What I learned from looking at 900 most popular open source AI tools

[ Hacker News discussion , LinkedIn discussion , Twitter thread ] Update (Feb 2026) : The full list of open source AI repos is hosted at Good AI List , updated daily. It’s balooned to 15K repos, and you can submit missing repos. You can also find some of them on my cool-llm-repos list on GitHub. Four years ago, I did an analysis of the open source ML ecosystem . Since then, the landscape has changed, so I revisited the topic. This time, I focused exclusively on the stack around foundation models. Data I searched GitHub using the keywords gpt , llm , and generative ai . If AI feels so overwhelming right now, it’s because it is. There are 118K results for gpt alone. To make my life easier, I limited my search to the repos with at least 500 stars. There were 590 results for llm , 531 for gpt , and 38 for generative ai . I also occasionally checked GitHub trending and social media for new repos. After MANY hours, I found 896 repos. Of these, 51 are tutorials (e.g. dair-ai/Prompt-Engineering-Guide ) and aggregated lists (e.g. f/awesome-chatgpt-prompts ). While these tutorials and lists are helpful, I’m more interested in software. I still include them in the final list, but the analysis is done with the 845 software repositories. It was a painful but rewarding process. It gave me a much better understanding of what people are working on, how incredibly collaborative the open source community is, and just how much China’s open source ecosystem diverges from the Western one. The Ne…


Cross Validated 2024-03-11 16:25 UTC Score 12.0 AI-113-20240311-social-media-3be64bf9

FD estimator: manual first differencing versus plm

I am working on a first-difference (FD) estimator for panel data (only two time periods). I calculated manually the first difference of each variable (dependent and two regressors) and then run an OLS on the first-differenced model: mydata $l_y y, -1) mydata $l_x1 x1, -1) mydata $l_x2 x2, -1) mydata $delta_y y - mydata $l_y mydata$ delta_x1 $x1 - mydata$ l_x1 mydata $delta_x2 x2 - mydata$l_x2 fd1 Then I run the FD estimation from the plm package on R but got completely different results: fd2 I am struggling to understand why the estimates are different. Any tips would be much appreciated.

LatAm Journalism Review AI 2024-03-11 15:14 UTC Score 23.0 AI-176-20240311-regional-ai--d437a430 Full article

The Haitian Times thrives by understanding its audience, making smart financial decisions and embracing AI

Despite the challenges faced by the media industry, the Haitian Times –a print and digital newspaper catering to Haitian immigrants in the United States– has managed to not only survive but thrive by adapting to the changing needs of its audience. Through a combination of smart financial decisions, leveraging technology like AI, and deeply understanding […] The post The Haitian Times thrives by understanding its audience, making smart financial decisions and embracing AI appeared first on LatAm Journalism Review by the Knight Center .

LatAm Journalism Review AI 2024-03-11 15:14 UTC Score 23.0 AI-176-20240311-regional-ai--d24246a3 Full article

The Haitian Times thrives by understanding its audience, making smart financial decisions and embracing AI

Despite the challenges faced by the media industry, the Haitian Times –a print and digital newspaper catering to Haitian immigrants in the United States– has managed to not only survive but thrive by adapting to the changing needs of its audience. Through a combination of smart financial decisions, leveraging technology like AI, and deeply understanding […] The post The Haitian Times thrives by understanding its audience, making smart financial decisions and embracing AI appeared first on LatAm Journalism Review by the Knight Center .

AI Stack Exchange 2024-03-07 14:56 UTC Score 18.0 AI-110-20240307-social-media-94011939 Full article

Using the definition of APAC learning and uniform convergence in practice

I am currently studying "Understanding Machine Learning from Theory to Practice" written by Shai Shalev-Shwartz and Shai Ben-David. I want to understand how i can use the Definitions and Results of the Theory he describes in Practice. Consider the problem of fitting a one dimensional polynomial to data; namely, our goal is to learn a function, $h : R → R$ , and as prior knowledge we consider the hypothesis class of polynomials up to degree 10. Our class $H$ has VCdim( $H$ )=11 so with the fundamental theorem of statistical learning it is APAC learnable with ERM. If i fix my $\epsilon,\delta \in (0,1)$ , then if my sample size is equal to $ C_2\frac{11+\log(1/\delta)}{\epsilon^2}$ i can be sure that with probability of atleast $1-\delta$ , ERM will output a hypothesis with \begin{equation} L_D(h_s)\leq \min_{h}L_D(h)+\epsilon. \end{equation} $C_2$ is a constant and $h_S$ is the hypotheis of the ERM algorithm. Now in practical Terms, this doesnt tell me anything about the quality of my Model. Because we dont know the underlying Distribution $D$ we can't compute $L_D(h)$ for any $h\in H$ . But i can compute $L_S(h)$ for every $h\in H$ in particular $L_S(h_S)$ . My intuition is then that we could use the uniform-convergence property of our class $H$ (VCdim(H) is finite) to get a bound for how much $L_D(h_S)-L_S(h_S)$ differ. With probability of atleast $1-\delta$ \begin{equation} L_D(h_S)\leq \min_{h}L_D(h)+\epsilon \leq \min_{h}{L_S(h)+\epsilon}+\epsilon=L_S(h_S)+2\epsilon \end…

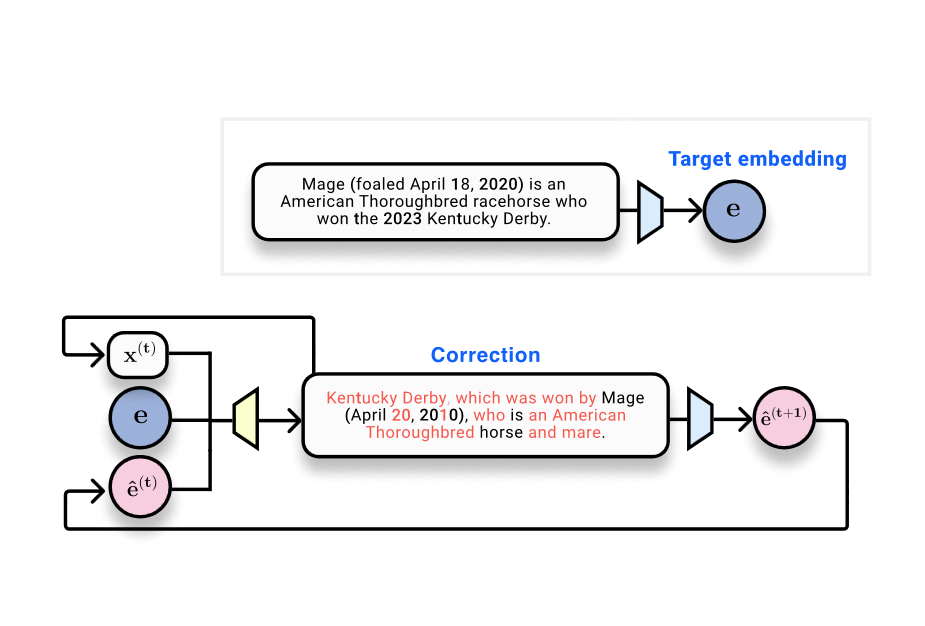
Do text embeddings perfectly encode text?
The Gradient 2024-03-05 20:15 UTC Score 12.0 AI-037-20240305-ai-specialis-c33e660e Full article

Do text embeddings perfectly encode text?

'Vec2text' can serve as a solution for accurately reverting embeddings back into text, thus highlighting the urgent need for revisiting security protocols around embedded data.

Instrumental variable for panel data
Cross Validated 2024-03-01 14:51 UTC Score 23.0 AI-113-20240301-social-media-e79d5f73 Full article

Instrumental variable for panel data

I am trying to quantify the effect of financial sanctions on cross-border capital flows. I have built a dyadic dataset of sanctions and capital flows by country pair and year. My sample period spans 20 years. I conducted a fixed effects regression where the explanatory variable for sanctions is a dummy variable that takes the value 1 in each year in which a sanction is imposed between a given country pair. I include fixed effects for each country pair and each year in the sample. \begin{equation*} \text{Capital_flows}_{c_1, c_2, t} = \beta_0 + \beta_1 \text{sanction}_{c_1, c_2, t} + \eta_{c_1, c_2} + \varphi_t + \varepsilon_{c_1, c_2, t} \end{equation*} (where $\eta_{c_1, c_2}$ is a set of country-combination specific fixed effects and $\varphi_{t}$ is a set of time-specific fixed effects.) As I understand, my fixed effects will remove all the time-invariant factors determining capital flows that were previously included in my error term. As such, I am now stuck with the various time-variant factors determining capital flows. Having done some reading, the main problem with my approach seems to be endogeneity, i.e., my sanctions dummy will be correlated with my error term. I was planning on addressing this issue by carefully adding additional (time-variant) control variables to my model. However, having spoken to one of my professors, he mentioned that the way to resolve this is through an instrumental variable approach and a Generalised Method of Moments estimator. I have se…

AI Stack Exchange 2024-03-01 11:08 UTC Score 15.0 AI-110-20240301-social-media-f6b0709f

KD-loss between intermediate feature maps of different channels

Assume a teacher model and a student model. Teacher is bigger than student in terms of depth and/or width, however, comes from the same "family". In addition to the loss that involves the ground-truth labels, I also want to distill intermediate output feature maps. Assume an intermediate feature map of a teacher of shape [teacher_c,h,w] and a feature map of the student [student_c,h,w] , what's the best way to distill different number of channels given same feature map resolution? If channels were the same, we could use L2 or something else, but this is not the case here. One option can be to avg pool to [h,w] , then L2, but that loses a lot of info. Another option is pair-wise L2, normalized: L2 between pairs of teacher<>student channels (basically teacher_c_i*student_c_j MSE of feature-maps. Any other suggestions?

Chip Huyen Blog 2024-02-28 00:00 UTC Score 44.0 USR-0111-20240228-ai-specialis-c129f1ef Full article

Predictive Human Preference: From Model Ranking to Model Routing

A challenge of building AI applications is choosing which model to use. What if we don’t have to? What if we can predict the best model for any prompt? Predictive human preference aims to predict which model users might prefer for a specific query. Human preference has emerged to be both the Northstar and a powerful tool for AI model development. Human preference guides post-training techniques including RLHF and DPO . Human preference is also used to rank AI models, as used by LMSYS’s Chatbot Arena . Chatbot Arena aims to determine which model is generally preferred. I wanted to see if it’s possible to predict which model is preferred for each query . One use case of predictive human preference is model routing. For example, if we know in advance that for a prompt, users will prefer Claude Instant’s response over GPT-4, and Claude Instant is cheaper/faster than GPT-4, we can route this prompt to Claude Instant. Model routing has the potential to increase response quality while reducing costs and latency. Another use case of predictive human preference is interpretability. Mapping out a model’s performance on different prompts can help us understand this model’s strengths and weaknesses. See section Experiment results for examples. Here’s what predictive human preference for different model pairs looks like for the prompt “ What’s the best way to cluster text embeddings? ”. The predictions were generated by my toy preference predictor. The bright yellow color for the (GPT-4,…

Cross Validated 2024-02-27 04:29 UTC Score 14.0 AI-113-20240227-social-media-34e49896

Question on the proof step in the theorem 1 of the Gap statistic paper

From the Gap statistic paper , during the proof for the theorem 1, we can see the below equality (p. 422), $\begin{aligned} \operatorname{var}(X) & =\frac{1}{2} \int_{-\infty}^{\infty} \int_{-\infty}^{\infty}(y-x)^2 f(x) f(y) \mathrm{d} x \mathrm{~d} y \\ & =\frac{1}{2} \int_0^1 \int_0^1\left\{F^{-1}(v)-F^{-1}(u)\right\}^2 \mathrm{~d} u \mathrm{~d} v \\ & =\int_0^1 \int_u^1\left\{\int_u^v \frac{1}{f\left\{F^{-1}(t)\right\}} \mathrm{d} t\right\}^2 \mathrm{~d} u \mathrm{~d} v\end{aligned}$ where $F$ and $f$ are unform CDF and PDF, respectively. As I struggled, lower bound in the 3rd line $u$ shuold be $ u= \frac{1}{2}$ to prove the equality between 2nd and 3rd lines. Do I think wrong? Thank you for any idea.

AI Stack Exchange 2024-02-26 14:48 UTC Score 18.0 AI-110-20240226-social-media-9d90c65e

ML Model for Route Optimization in Manufacturing

I am looking for a ML Model for route optimization within a factory. I am starting simple with optimizing 1 aisle (2 rows). We have a bunch of criteria, and it would be dependent on the data at that time to create an optimal route. For now I want to stay within 1 aisle, so I don't know if ant colony is the answer. I am looking for a suggestion of which model should I use? RL, GA etc. we have a df of shelf, rack, row, item and when it was assigned to come down (starting with just rows 1 and 2) The driver can access 2 rows of shipping locations at the same time, and the rows' rack numbers and shelf numbers are aligned with each other . For example, the shipping locations at rack 4 and shelf 3 are accessible for row 1 and row 2 at the same time, as those rows are linked to each other, so the machine driver can get items from those 2 shipping locations at the same exact time. Machine max capacity is 60 cf - The items with the highest priority are items with the earliest dock assignment time but if a load is assigned to a dock at a similar time to the earliest dock assignment, and has significantly fewer items than a load with the earlier dock assignment time, prioritize the smaller load. Calculate whether the item will fit into the machine in order to be removed from its shipping location. Consider the size of the item and the capacity available in the machine. When creating the route, prioritize staying within the same rack number higher than staying within the same shelf numbe…

AI Stack Exchange 2024-02-25 23:05 UTC Score 18.0 AI-110-20240225-social-media-fe2fb2dc Full article

What does "factor" mean in the context of dummy variables?

I am reading The Elements of Statistical Learning: Data Mining, Inference, and Prediction by Trevor Hastie, Robert Tibshirani, Jerome Friedman, and I don’t understand the meaning of "factor" in the following paragraph: Qualitative variables are typically represented numerically by codes. The easiest case is when there are only two classes or categories, such as “success” or “failure,” “survived” or “died.” These are often represented by a single binary digit or bit as 0 or 1, or else by −1 and 1. For reasons that will become apparent, such numeric codes are sometimes referred to as targets. When there are more than two categories, several alternatives are available. The most useful and commonly used coding is via dummy variables. Here a K-level qualitative variable is represented by a vector of K binary variables or bits, only one of which is “on” at a time. Although more compact coding schemes are possible, dummy variables are symmetric in the levels of the factor . Also I want to know what mathematics knowledge I should have to understand this book and if it’s deprecated or not.

What´s does "factor" means in the context of dummy variables?
AI Stack Exchange 2024-02-25 23:05 UTC Score 18.0 AI-110-20240225-social-media-56c3ea62 Full article

What´s does "factor" means in the context of dummy variables?

I am reading The elements of statistical learning : data mining, inference, and prediction / Trevor Hastie, Robert Tibshirani, Jerome Friedman and I don´t understand the meaning of "factor" in the following paragraph: Qualitative variables are typically represented numerically by codes. The easiest case is when there are only two classes or categories, such as “suc- cess” or “failure,” “survived” or “died.” These are often represented by a single binary digit or bit as 0 or 1, or else by −1 and 1. For reasons that will become apparent, such numeric codes are sometimes referred to as targets. When there are more than two categories, several alternatives are available. The most useful and commonly used coding is via dummy variables. Here a K-level qualitative variable is represented by a vector of K binary variables or bits, only one of which is “on” at a time. Although more compact coding schemes are possible, dummy variables are symmetric in the levels of the factor . Also I want to know what math´s knowledge I should have to understand this book and if it´s deprecated or not.

Why Doesn’t My Model Work?
The Gradient 2024-02-24 18:41 UTC Score 16.0 AI-037-20240224-ai-specialis-4864d136 Full article

Why Doesn’t My Model Work?

Have you ever trained a model you thought was good, but then it failed miserably when applied to real world data? If so, you’re in good company.

Why do adversarial attack transfer well?
AI Stack Exchange 2024-02-22 09:30 UTC Score 15.0 AI-110-20240222-social-media-3e625c54 Full article

Why do adversarial attack transfer well?

I have read (*) that a common technique to attack a black box AI system based on a neural network is to use it to train a surrogate model to make the same classifications as the black box one. Once this is done, one can look for adversarial examples on the surrogate model (on which the attacker has access to all the weights and can compute gradients). The key property that makes such attacks successful is transferability : an adversarial example on the surrogate model is likely to be an adversarial example on the black box model. Question: Do we know why such transferability properties hold and under which conditions? (*) Although I don't remember where I first read it, this is mentioned in the book Not with a bug but with a sticker although it doesn't get into technical details (this is a book for the general public).

Gradually increasing CPU load on using sentence embeddings model with kmeans
AI Stack Exchange 2024-02-20 13:24 UTC Score 21.0 AI-110-20240220-social-media-0220fc42 Full article

Gradually increasing CPU load on using sentence embeddings model with kmeans

I am having a ML based production application, using flask, deployed on GCP server using gunicorn workers. In each incoming request, a text sentence is received. It is using sentence transformers (All-MiniLM-L6-v2 model), which is loaded globally one time, to create embeddings of the incoming text and then use pre trained kmeans (also loaded globally) to predict/map it to a intent cluster. Basically, goal is to find intent of the sentence. I have ample resources and the requests are also constant in number and texts are also similar, but still each day the CPU load is gradually increasing. Avg response time on 1st day was around 200 ms average, after 10 days now it is 400 ms. I have tried deleting the embedding variable using 'del' command in the code itself, also forcing python garbage collector using 'gc.collect()' in a thread which executes after the main process execution is completed, but still the issue is coming. One thing I have noticed is that if I dont use del and gc.collect(), the RAM starts to go down gradually. With both these, RAM is constant but now CPU usage is gradually going up day by day, hence the load and response time. I have spent weeks on this issue trying to debug it but have got no solution, any help would be appreciated.

How does using the ELBO in VAEs make the problem tractable?
AI Stack Exchange 2024-02-19 03:19 UTC Score 12.0 AI-110-20240219-social-media-28e47aa6 Full article

How does using the ELBO in VAEs make the problem tractable?

I'm studying Variational Autoencoders and a lot of the literature says that the posterior is intractable because the marginal distribution p(x) is intractable since the space of z is so large we cannot possibly integrate over it all. So to avoid this they create a lower bound on the log likelihood, the ELBO, which they then try to maximize. The term for the ELBO is: $$E_q[log~ p(z,x)]-E_q[log~q(z)]$$ What I am trying to understand is how is this now tractable. The expectations in the ELBO are still over the distribution of q. Take the first term for example: $$E_q[log~ p(z,x)]=\int_{}^{}q(z)~log~p(z,x)dz$$ Is this not still an integral over all z values? How did we make this problem any more tractable by finding the ELBO? Additional Question: Also another thing I was confused about is we always say the posterior p(z|x) is not computable because we don't have p(x), but how exactly do we have the numerator, p(x,z). $$p(z|x)=\frac{p(x,z)}{p(x)}$$ Is this because we assume a prior, and then also assume that we can model p(x|z) with a decoder?

AI Stack Exchange 2024-02-14 15:51 UTC Score 18.0 AI-110-20240214-social-media-6562e694 Full article

Are there cases where Variational Auto-Encoders (VAE's) are preferred to other techniques?

The best reason I have seen for using variational autoencoders is when dealing with sparse data. The Gaussian noise "splats" out the input distribution (see this StackExchange answer ). However, normalizing flows do the same thing, without the loss of information a VAE incurs. It feels as if VAEs are used only because everyone else is using them, and then a bunch of StackExchange posts reinforce the message that VAEs are the way to go , when they're theoretically suboptimal. I understand that normalizing flows are a little slower (at either training or inference), and more difficult to implement, but is there a theoretical reason that makes VAEs a legitimate choice?

How to handle correlated variables before using Recursive Feature Elimination?
Cross Validated 2024-02-14 14:48 UTC Score 17.0 AI-113-20240214-social-media-e6a6814d Full article

How to handle correlated variables before using Recursive Feature Elimination?

I have seen a few Kaggle notebooks that list without reason that RFE works better when removing correlated variables. I struggle to see the reason why so I conducted some of my own research and would like to verify if my conclusions are correct. From my research with sklearn's CART algorithm, I have taken a good predictive feature (Feature A) and a highly correlated feature with some extra noise (Feature B). It seems that due to high correlation, their mean impurity decrease is very similar and the splits roughly split the feature importance between the two variables. This creates situations where Feature A and Feature B can be ranked highly if Feature A is a good predictor despite Feature B being redundant. Feature B will likely not be removed for several iterations and reduce the model score for these first few iterations, thereby limiting the combination of features that RFE considers. But I presume there are multiple factors that influence the way we identify a "highly correlated variable". At which correlation cutoff point do we determine that the variables will hurt the RFE feature selection process? For example, the number of splits in the algorithm will be one determining factor. If Feature A only has a single split, then Feature B will not benefit from having high correlation with Feature A, and likely be removed by RFE without problems.

Anyscale Blog 2024-02-13 06:00 UTC Score 41.0 USR-0085-20240213-ai-specialis-0a5ce02a Full article

Fine-tuning LLMs for longer context and better RAG systems

Update June 2024: Anyscale Endpoints (Anyscale's LLM API Offering) and Private Endpoints (self-hosted LLMs) are now available as part of the Anyscale Platform. Click [here](https://console.anyscale.com/?utm_source=anyscale&utm_medium=blog&utm_campaign=blog_callout&utm_content=june2024_product_update_subheading) to get started on the Anyscale platform.

Cross Validated 2024-02-06 23:58 UTC Score 18.0 AI-113-20240206-social-media-c15c0668

Estimating an unknown distribution from a mixture

I have two data sets, $\{x_i\}$ and $\{y_i\}$ . I know that data set $\{x_i\}$ was sampled from some distribution $X$ , and that data set $\{y_i\}$ is sampled from a mixture of the $X$ , and some other unknown distribution $Y$ . I am wanting to estimate what the mixing ratio is/to know how many of the samples in $\{y_i\}$ come from $X$ . If I make some assumptions about $Y$ (such as it being normal) this is just a simple mixture model problem, but ideally I don't want to do this. I'm wondering if there is some approach to this problem, or if it isn't possible. One idea that I had was to have a bunch of kernels (evenly spaced normal distributions with known $\sigma$ ), and use MLE to find their mixing ratios, but I assume doing so would just set the mixing ratio for $X$ to be zero, and just give me the KDE. Perhaps there is some way of penalising this, but my only thought was to set a prior on what I thought the mixing ratio of $X$ was, which I would rather avoid. If it is possible to solve this problem for categorical mixture models, than I can just bin my data, but I couldn't find a way of solving this problem in a categorical sense either, or really anything to do with parameter estimates for categorical mixture models (which makes sense because the sample distribution would have the maximum likelihood)

How did Auguste Bravais come up with the regression line?
Cross Validated 2024-02-05 22:41 UTC Score 17.0 AI-113-20240205-social-media-9f971eb4 Full article

How did Auguste Bravais come up with the regression line?

I am new to statistics and linear regression and I came across the face that auguste bravais discovered regression line but didn't realize it. Auguste Bravais (1811-1863), professor of astronomy and physics, is probably best known for his work in crystallography (Nelson, 1998). With respect to error theory, he is best known for a paper he wrote in 1846 titled "Analyse mathématique sur les probabilités des erreurs de situation d'un point" [translated: "Mathematical analysis on the probability of errors of a point"]. This work is renowned for being the very first mathematical exposition of the theory of correlation. Pearson (1896), later to recall these remarks, said that it was Bravais who first discussed the fundamental theorems of the correlational calculus. In his famous paper of 1846, Bravais, mathematically, not empirically, found the equation of the normal surface for the frequency of error. Using both analytic and geometric methods, Bravais also essentially found what would eventually be coined "regression line." He did so through investigating how the various elliptical areas of the frequency surface vary given various directly observed quantities. Through this, he found the line of regression, but, in essence, did not realize it, and thus could not "make the leap" (Walker, 1929) necessary to claim the discovery of correlation or regression My question is how did he use "various elliptical areas of the frequency surface" to come across the regression line? I don't und…

Lilian Weng Blog 2024-02-05 00:00 UTC Score 50.0 USR-0112-20240205-ai-specialis-79c273e2 Full article

Thinking about High-Quality Human Data

[Special thank you to Ian Kivlichan for many useful pointers (E.g. the 100+ year old Nature paper “Vox populi”) and nice feedback. 🙏 ] High-quality data is the fuel for modern data deep learning model training. Most of the task-specific labeled data comes from human annotation, such as classification task or RLHF labeling (which can be constructed as classification format) for LLM alignment training. Lots of ML techniques in the post can help with data quality, but fundamentally human data collection involves attention to details and careful execution. The community knows the value of high quality data, but somehow we have this subtle impression that “Everyone wants to do the model work, not the data work” ( Sambasivan et al. 2021 ).

Cross Validated 2024-02-02 17:00 UTC Score 9.0 AI-113-20240202-social-media-9ca475c7

How to combine soft-max value from two or more neural networks

Consider a scenario where we have some input variable $X$ (maybe an image), which goes through several noisy path and we generate $K$ noisy observations: \begin{align} Y_i = X_i +Z_i, i \in \{1,\ldots, K\} \end{align} where noises are independent. Here I am assuming additive structure but it doesn't have to be. Suppose that I use the same neural network on $Y_i$ 's to classify. Also, suppose that I have access to the soft-max values In particular, let $p_i$ be the soft-max value for input $Y_i$ , Question: How do I combine these values in the best way to determine my class? One option is \begin{align} p_{new} = \frac{1}{K} \sum_{i=1}^K p_i \end{align} One can also just threshold at $0.5$ and find the majority. I am looking for an answer that would have some theoretical backing.

Determining percentile of a salary within a survey of salaries
Cross Validated 2024-02-02 14:44 UTC Score 9.0 AI-113-20240202-social-media-eaf416cc Full article

Determining percentile of a salary within a survey of salaries

I am not a statistics expert, so forgive me if this question is too simplistic. I have the following salary survey for a position: Someone internally is making: What is the easiest way to calculate the percentile of the salary within the salary survey for the position?

How to make a model forget specific training it has received?
AI Stack Exchange 2024-02-02 08:52 UTC Score 18.0 AI-110-20240202-social-media-21096377 Full article

How to make a model forget specific training it has received?

Does L1/L2 (NAdam weight decay) really make the model "unlearn"? Ok so my question might be dumb but is there any way to "unlearn" a model - and yeah I know there is wieght_decay and L1 and L2 - but I'm thinking like instead having a way to tell a model to forget specific thing it has learned so like untrain it from certain cases. And my questions is worded this way because L1/L2 was the only thing I've found close to what I ask but I don't think it's exactly what I'm searching for - instead as I've worded it above I want instead of having a pass which "trains" the model specific outcome to have a "pass" which reverts that training (not train on different outcome). So after it has unlearned this training - it predicts with all the other training it has received before. Thanks in advance. A possible solution I'm thinking is like keeping the weights of the model before and/or after the training I want to make it unlearn and then somehow use it to do the unlearning but not sure.

fAIr LAC 2024-01-31 13:07 UTC Score 22.0 USR-0219-20240131-ai-specialis-62e33a4b Full article

Acuadata

Acuadata @administrador Mié, 31/01/2024 - 13:07 Las pérdidas de agua no técnicas en América Latina y el Caribe representan un desafío significativo en la gestión eficiente de los recursos hídricos. Estas pérdidas, que incluyen fugas y problemas en la distribución, contribuyen a un uso ineficiente del agua, lo que a su vez afecta la disponibilidad y la sostenibilidad de este recurso vital. Para abordar este problema, es esencial implementar estrategias integrales que combinen la tecnología avanzada con la capacitación adecuada y la gestión eficaz, con el objetivo de reducir las pérdidas de agua y garantizar un suministro sostenible para las comunidades en toda la región. Problema que se busca resolve En los países de la región de América Latina y el Caribe, se observan niveles elevados de pérdidas de agua, con aproximadamente el 38% del agua perdida antes de la facturación. En la Empresa Pública Metropolitana de Agua Potable y Saneamiento de Quito (EPMAPS), este indicador se sitúa en el 29%. EPMAPS tiene como objetivo reducir las pérdidas comerciales de agua en un 1%, mantener el nivel de multas y disminuir el número de inspecciones y personal en el equipo de monitoreo. Poblaciones que se ven afectadas por el problema Consumidores servicios de agua Respuesta actual a este problema, considerando a las instituciones relacionadas. Detectar las perdida no técnica de agua requiere una inmensa cantidad de datos, realizar este análisis de manera manual ha llevado a una baja efectivi…