AI/ML News & Innovations Hub

AI/ML news, top picks, and generated innovation digests.

★ Visit ai-karthik.com
422Sources
40179News Items
8Top Picks
238Blogs
successLast Run

Latest AI/ML News

40179 matching items

How to interpret DCC GARCH alpha and beta (dcca1 and dccb1 in R)
Cross Validated 2023-12-03 19:56 UTC Score 12.0 AI-113-20231203-social-media-c04d9e16 Full article

How to interpret DCC GARCH alpha and beta (dcca1 and dccb1 in R)

I have just run a DCC GARCH model in R and am trying to interpret the output. I have run the model with 3 time series. I know that alpha and beta tell about the short- and long-term spillover effect. However, I only get one dcca1 and dccb1 even though the values of dcca1 and dccb1 should be different for the different time series. So what do dcca1 and dccb1 tell me?

Transformers: Cross Attention Tensor Shapes During Inference Mode
Cross Validated 2023-12-01 21:33 UTC Score 21.0 AI-113-20231201-social-media-26df2fd4 Full article

Transformers: Cross Attention Tensor Shapes During Inference Mode

Using the "classic" transformer model describing in "Attention is All You Need", I'm struggling to understand how the Encoder output is used by the Decoder during cross attention while in inference mode, specifically how the actual matrix multiplication can happen. During training mode, everything makes sense to me: The Encoder outputs a tensor of shape (B, T, C) where B = batch_size, T = max_tokens, and C = d_model = embedding dimension size. This is passed to the Decoder and changed to shape (B, T, T) through the scaled dot product mechanism (will call this tensor A ) A is multiplied by the Decoder's value tensor of shape (B, T, HS) where HS = depth = head size. This multiplication is possible because the shapes of the tensors comply (B, T, T) @ (B, T, HS) --> (B, T, HS) . But in inference mode we start with a Decoder value tensor that will only have a token length of 1 , so a tensor shape of (1, 1, HS) , where T != 1, and then expand the sequence from there. So, during the cross attention step with the Encoder, how can A with shape (1, T, T) be multiplied with (1, 1, HS) ? Clearly, I'm missing something pretty big here, so any help would be much appreciated!

how can I evaluate the unbalanced data set
Cross Validated 2023-11-29 11:54 UTC Score 9.0 AI-113-20231129-social-media-68d4cd5f Full article

how can I evaluate the unbalanced data set

The output here shows the titles and descriptions of the comments written for the evaluation of the top 100 books in amazon with nltk vader, and the total reviewer rating for those analyzes, but there is an imbalance between reviewer rating how can I statistically make sense of the data here 1 : https://i.sstatic.net/2N5Cv.png custrew[["reviewer rating","title sentiment result","desc sentiment result"]] \ .groupby(["title sentiment result","desc sentiment result"]).sum() code of output def duygu_analizi(text): sentiment = analyzer.polarity_scores(text) if sentiment['compound'] >= 0.05: return 'Pozitif' elif sentiment['compound'] example code for title sentiment result also my data (ı dont show another columns because no necessary): my goal is just define a relationship between title/description sentiement analysis and reviewer rating. when sentiment is positive, are reviewer ratings be positive too? or When sentiments are intense, does your rating also tend to be high? ı have two distinct variable for title sentiment and description sentiment

How should I analyze my Likert scale data?
Cross Validated 2023-11-28 14:57 UTC Score 12.0 AI-113-20231128-social-media-b2657f4d Full article

How should I analyze my Likert scale data?

I am a high schooler conducting a survey on a group of 20 other high schoolers. They will take a 10 item pretest questionnaire containing 9 5-point Likert scale questions and 1 short-answer response question before viewing a film. After screening is complete, they will take the same questionnaire (labeled posttest just to make analysis easier) again. I am trying to find a way to identify and interpret differences in participants' responses to the Likert scale questions between the pretest and posttest questionnaire. I am looking to analyze the Likert scale questions as quantitative data, but I am unsure of how to do this and what software to use.

Correlations between cousins when many individuals are part of several cousin pairs
Cross Validated 2023-11-27 21:44 UTC Score 20.0 AI-113-20231127-social-media-10bf745a Full article

Correlations between cousins when many individuals are part of several cousin pairs

I have a data set with thousands of pairs of cousins. There is a row for each cousin pair, with two columns: One column for the test score of one of the cousins in the pair, and one column with the test score of the other cousin. I want to calculate the correlation between cousins on this test. I could then just correlate the two columns. But I then worry that there would be problems related to the fact that many individuals have several different cousins, so that they are part of many of the rows in the data. Am I right to worry about this? What are the specific problems that can follow from this? And what are some more appropriate ways to calculate the correlation, which are computationally feasible for a dataset with hundreds of thousands of rows? (I'm hopeful that there are ways that do not involve dropping rows from the data until every individual are part of only one pair)

Cross Validated 2023-11-27 17:11 UTC Score 17.0 AI-113-20231127-social-media-a4a976c9 Full article

Outlier Detection and Removal [closed]

I am reading a paper on wind power forecasting and the authors present a plot of the data before outliers are removed and a plot after. However, they don't actually say what method was employed to remove the outliers. I was hoping someone might offer some guesses or hints on how one would go about obtaining plot (b) from plot (a). Edit The paper is here: One-Day-Ahead Hourly Wind Power Forecasting Using Optimized Ensemble Prediction Methods by Chao-Ming Huang 1, Shin-Ju Chen, Sung-Pei Yang and Hsin-Jen Chen

Correlation structure for covariate variables in longitudinal regression
Cross Validated 2023-11-27 16:14 UTC Score 15.0 AI-113-20231127-social-media-f7745750 Full article

Correlation structure for covariate variables in longitudinal regression

In longitudinal regression(ex: repeated measures for different people), we have the option to choose a correlation structure for the response variable. For example ( https://youtu.be/qoqhPq_VILc?si=yJmlrWR4hlgOz1IL ): But is it ever possible to have these kinds of correlation structures for the independent variables? I suspect that in many scenarios, the independent variables (covariates) are also correlated for the same subject from measurement to measurement. For example, in geriatric overweight patients, the patient weight (kilograms) almost always increases from measurement to measurement for the same patient (ie correlated). Thus, for the same patient, the weight variable is not IID .... which can be a violation of assumptions. Is there any modelling approach I can use for longitudinal regression (repeated measures) when I suspect that the independent variables have some correlation? Can I specify a correlation structure as well?

AI Stack Exchange 2023-11-21 09:32 UTC Score 12.0 AI-110-20231121-social-media-d0abda07

In k-NN, how does the condition $k(N)/N \to 0$ ensure that all the k nearest neighbors are close to a given test point $\mathbf{x}$?

Consider the k-NN algorithm and let $k(N)$ be the choice of k as a function of N (data points). For $N \to \infty$ , if $k(N) \to \infty$ and $k(N)/N \to 0$ , then k-NN converges to optimal classifier. Question: How does the condition $k(N)/N \to \infty$ ensure that all the k nearest neighbors are close to a given test point $\mathbf{x}$ ? For content, please see: https://amlbook.com/eChapters/6-Oct2022-readeronly.pdf Theorem 6.2 Password: Paraskavedekatriaphobia

AI Stack Exchange 2023-11-20 16:09 UTC Score 18.0 AI-110-20231120-social-media-dcbe381c

Meaning of "error on the test point x" in optimal classifier for binary classification

Let f(x) be optimal classifier for binary classification where output is modelled noisy. What does it mean "f(x) makes a mistake only if there is an error on the test point x"? Basically, what is meant by "error on the test point x"? For content, please see: https://amlbook.com/eChapters/6-Oct2022-readeronly.pdf Password:Paraskavedekatriaphobia Page: 6, last paragraph

Cross Validated 2023-11-19 19:03 UTC Score 15.0 AI-113-20231119-social-media-e1a64a92

Interpreting Coefficients of brms Bernoulli family model

I am struggling with interpreting model results from a brm() model. The first result uses scaled and centered data with command scale(df$column, scale = TRUE, center = TRUE). > summary(global.use.initial) Family: bernoulli Links: mu = logit Formula: use ~ 1 + iogs_std + ipred_std + idepth_std + idry_std + iopenwater_std + ibroodaltered_std + icc_std + ivosum_std + ic + entrancedir + boxage_std + pguardtype + neighbor_std + wetland.type + bpp + (1 | year) + (1 | site) Data: Masterintialusewatt.initalonly.naomit (Number of observations: 825) Draws: 4 chains, each with iter = 16000; warmup = 8000; thin = 1; total post-warmup draws = 32000 Group-Level Effects: ~site (Number of levels: 3) Estimate Est.Error l-95% CI u-95% CI Rhat Bulk_ESS Tail_ESS sd(Intercept) 1.04 1.06 0.03 3.90 1.00 9107 10772 ~year (Number of levels: 4) Estimate Est.Error l-95% CI u-95% CI Rhat Bulk_ESS Tail_ESS sd(Intercept) 0.61 0.47 0.15 1.87 1.00 9120 13385 Population-Level Effects: Estimate Est.Error l-95% CI u-95% CI Rhat Bulk_ESS Tail_ESS Intercept -0.25 0.99 -2.47 1.79 1.00 11429 8999 iogs_std 0.65 0.18 0.31 1.01 1.00 26064 24495 ipred_std -0.31 0.20 -0.70 0.09 1.00 21572 23319 idepth_std 0.55 0.15 0.27 0.84 1.00 32939 23456 idry_std 0.20 0.11 -0.02 0.42 1.00 34767 23558 iopenwater_std -0.18 0.10 -0.40 0.00 1.00 35240 22896 ibroodaltered_std 0.12 0.12 -0.11 0.34 1.00 34813 20159 icc_std -0.42 0.17 -0.75 -0.10 1.00 34900 23951 ivosum_std -0.22 1.13 -2.49 1.98 1.00 41638 20542 icInland 0.66 1.71 -3.07 4…

AI Stack Exchange 2023-11-19 14:56 UTC Score 12.0 AI-110-20231119-social-media-9c4a5ddd

How to accurately detect grid cell boundaries in Python image processing?

I'm working on a Python algorithm to detect individual cells of a grid passed by an image. Currently, I'm facing an issue where the values inside each cell are being selected as contours along with the cells themselves. As you can see: Here's part of my current code: # Read the image image = cv2.imread(image_path) # Convert the image to grayscale gray = cv2.cvtColor(image, cv2.COLOR_BGR2GRAY) # Apply Gaussian blur to remove noise for simplifying grid line identification blur = cv2.GaussianBlur(gray, (5,5), 0) # Apply adaptive threshold to the image (to handle variations in brightness and contrast) thresh = cv2.adaptiveThreshold(blur, 255, 1, 1, 11, 2) # Find the largest contour, which represents the grid itself max_area = 0 c = 0 contours, _ = cv2.findContours(thresh, cv2.RETR_TREE, cv2.CHAIN_APPROX_SIMPLE) # here I tried both cv2.RETR_EXTERNAL and cv2.RETR_TREE but none of them seems to work for i in contours: area = cv2.contourArea(i) if area > 1000: if area > max_area: max_area = area best_cnt = i image = cv2.drawContours(image, contours, c, (0, 255, 0), 3) c += 1 # Create a mask to search only within these boundaries mask = np.zeros((gray.shape), np.uint8) cv2.drawContours(mask, [best_cnt], 0, 255, -1) cv2.drawContours(mask, [best_cnt], 0, 0, 2) # Cut away the identified mask from the image out = np.zeros_like(gray) out[mask == 255] = gray[mask == 255] # Apply blur and adaptive threshold to this new image blur = cv2.GaussianBlur(out, (5,5), 0) thresh = cv2.adaptiveThresh…

Comment on Step-By-Step Implementation of GANs on Custom Image Data in PyTorch: Part 2 by Mel Dorn
TOPBOTS 2023-11-18 08:21 UTC Score 12.0 AI-043-20231118-ai-specialis-4220f1d6 Full article

Comment on Step-By-Step Implementation of GANs on Custom Image Data in PyTorch: Part 2 by Mel Dorn

You got my attention. Learning Image Data and its role very interesting for me. As a photographer, I am constantly looking for information that can help grow my professionalism. I also couldn’t ignore this article offers valuable insights into perfecting nature photography, enhancing my appreciation for this art form.

Anyscale Blog 2023-11-15 00:00 UTC Score 35.0 USR-0085-20231115-ai-specialis-a9377c50

Building an LLM-powered GitHub bot to improve your pull requests

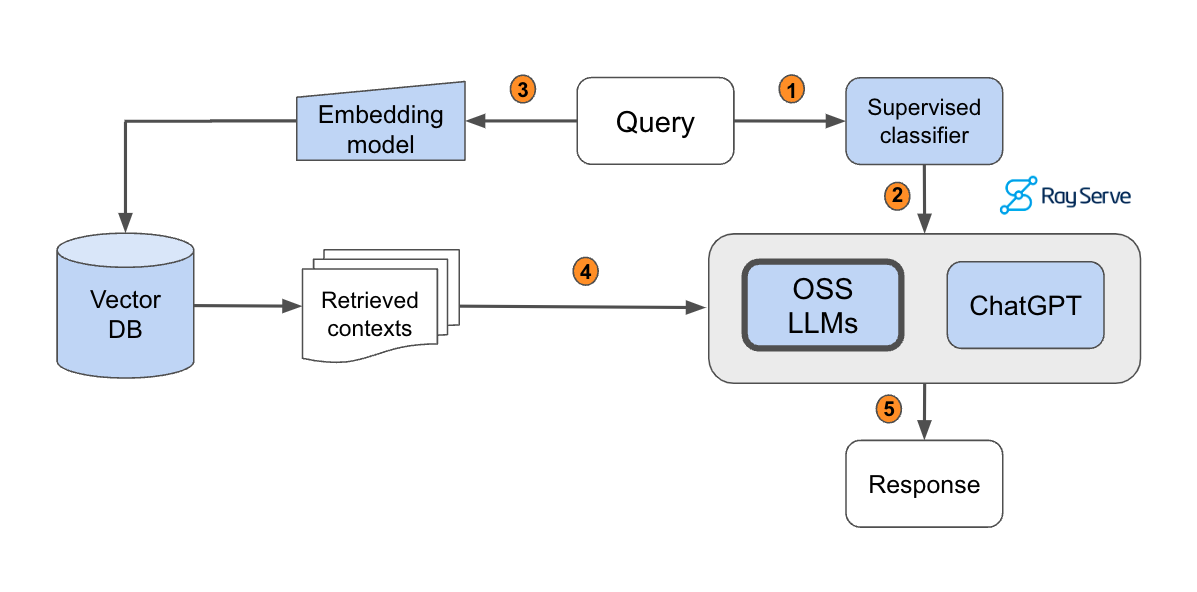
Update June 2024: Anyscale Endpoints (Anyscale's LLM API Offering) and Private Endpoints (self-hosted LLMs) are now available as part of the Anyscale Platform. Click [here](https://console.anyscale.com/?utm_source=anyscale&utm_medium=blog&utm_campaign=blog_callout&utm_content=june2024_product_update_subheading) to get started on the Anyscale platform.

Best way to set-up a linear mixed model analysis for medical device bench data?
Cross Validated 2023-11-14 21:29 UTC Score 12.0 AI-113-20231114-social-media-a95aa457 Full article

Best way to set-up a linear mixed model analysis for medical device bench data?

I am working on a bench study comparing two commercial devices (Device X and Device Y) and their ability to hold contact force over 30 seconds on a substrate at 2 independent angles (16 and 130). This will be done on fresh devices and after multiple articulations (0, 50, 100, and 120). The more articulations = device fatigue, so predicting it can reduce contact force stability (i.e. more variability). The output we are looking at is 'mean contact force' (over 30 seconds) and any variability. Since these samples are not independent, I anticipate the need for a linear mixed model analysis. Any preference of using GraphPad or R. If R, how would I establish the initial lmm equation with the multiple levels?

AI Stack Exchange 2023-11-14 14:24 UTC Score 21.0 AI-110-20231114-social-media-a6b177fa Full article

How can we construct a skewed noise distribution using the maximum likelihood approach?

When the probability of observing a large positive error is larger than the probability of observing a large negative error in binary classification, how can this be modelled by a skewed noise distribution using the maximum likelihood approach? The content is as follows: From page 103 of: http://smlbook.org/book/sml-book-draft-latest.pdf "Using the maximum likelihood approach, other assumptions about the noise or insights into its distribution can be incorporated in a similar way in the regression model (5.1). For instance, if we believe that the error is non-symmetric, in the sense that the probability of observing a large positive error is larger than the probability of observing a large negative error, then this can be modelled by a skewed noise distribution. Using the negative log-likelihood loss is then a systematic way of incorporating this skewness into the training objective."

AI Stack Exchange 2023-11-12 12:36 UTC Score 13.0 AI-110-20231112-social-media-49108cc8

Masking in Decoder of Transformer

I understand that the masked multi-head attention block ensures that generation of token at time step t doesn't rely on subsequent tokens of the input. But the residual connection which adds the input to the output of masked multi-head attention block adds some of the information from future time steps which is then used to construct the query matrix for multi-head attention block. Shouldn't some kind of mask be applied before adding the input values to the output of masked multi-head attention block as well? Asking this question in the context of training process.

Testing difference between datasets from binomial distributions
Cross Validated 2023-11-11 20:54 UTC Score 23.0 AI-113-20231111-social-media-109b5ebc Full article

Testing difference between datasets from binomial distributions

We will be conducting an experiment where a group of $N$ people take a test that has $M$ independent yes-no questions. We compute the number of questions each person $j$ gets correct as a score $m_j$ . It seems reasonable to model the score as a binomial random variable $m_j\sim B(n=M, p=p_j)$ . However, we have no prior knowledge about $p_j$ , and since the test requires skill, it seems that $p_j$ could vary from one person to the next. Question 1: Is it reasonable to use the average score over the population, $m^* = \frac{1}{N}\sum_1^N m_j$ , as the value of $p_j$ for all $j$ ? Thus, we model each of the $N$ scores as a draw from the same distribution $B(n=M, p=m^*)$ . Then, say we repeat the experiment on a new group of $N$ people with a different test (still $M$ independent yes-no questions). We would like to know if the performance on the second test is better than on the first. Question 2: What is the best way to determine if the second population had better scores than the first? Does the answer to Q2 change if we can or cannot model each population as coming from $B(n=M, p=m^{\ast})$ with different $m^{\ast}$ as in Q1. I have considered using a one-sided Welch's t-test on the populations of scores $m_j$ to determine if the average score $m^\ast$ is different between experiment 1 and 2 -- the null hypothesis is that $m^\ast$ is the same for the two experiments, and if we reject the null hypothesis then we can say the second population performed better. The data is unp…

AI Stack Exchange 2023-11-11 04:12 UTC Score 17.0 AI-110-20231111-social-media-2b726d47

Why is my agent stuck on the same action in my Twin Delayed Deep Deterministic Policy Gradient (TD3) program?

I've been tirelessly converting a reinforcement learning program from Python to JavaScript using TensorFlow.js that is running Twin Delayed Deep Deterministic Policy Gradient (TD3). I'm just trying to make a basic blueprint for myself and the community to use. I've put in a lot of work and I feel like it should basically be complete, but I can't find out why the agent keeps (very quickly) converging on a single action selection (even though it's being penalized for doing so, even testing at 300 iterations). I checked the loss variables and they seem to be working as expected. Although I'm great with JavaScript and have a solid understanding of how everything works, I'm not a professional with Python or TensorFlow.js (yet). I need some people with experience in the following areas to review my code: Reinforcement Learning, TD3 (or DDPG), Tensorflow.JS. Everything is on GitHub at https://github.com/CloudZero2049/TD3-TensorFlowJS All the info about the project is in the README. TD3script.js is the only one to worry about, there's also one without comments. I have been reviewing the code and math extensively everything seems to be working properly. But when testing the agent quickly settles on a single bad action even though it's being penalized. I tried 300 iterations, 200 warmup, 100 batch_size to see if it was a time issue without a change. I feel confident in the structure and math but something is clearly wrong. After going over the code so many times and making improvement…

Cross Validated 2023-11-08 14:12 UTC Score 9.0 AI-113-20231108-social-media-c759734b

GLM: invalid value encountered in log special.gammaln

I've never used GLM before so I would like to have some hints on how to use it and if I'm missing any steps. My challenge: I want to know if the price of product is influenced, positively or negatively by other variables that I can measure: Production time of a machine that stays on to build the product during a day How much time it takes to build one single product in a day How much is the manpower cost per product in a day How many products are built in a day I thought that using a GLM would help me understand this. However, I have two doubts: Should I study the distribution of my variables before choosing the type of family of GLM? I use Python to do the GLM but I get a warning: RuntimeWarning: invalid value encountered in log special.gammaln(n - y + 1) + y * np.log(mu / (1 - mu + 1e-20)) + RuntimeWarning: invalid value encountered in log n * np.log(1 - mu + 1e-20)) * var_weights But I don't understand what it means. How should I interpret the results? When following tutorials, the coef were more interpretable than what I got (ex. 0.67) --- For reproducibility, here is the code I used --- # creating the Numpy array array = np.array([[4, 441, 25, 4, 17], [10, 444, 49, 8, 9], [3, 483, 12, 2, 38], [2,447,10,1,43], [4,423,22,3,19], [3,19,19,3,1], [18,445,111,17,4], [7,423,42,7,10], [9,426,53,8,8], [12,378,54,8,7], [36,450,225,36,2],]) # creating a list of column names column_values = ['CONST', 'ACTUAL_PRODTIME', 'TIME_LOGO', 'COST_PPL_LOGO', 'LOGO'] # creating the dataframe d…

LatAm Journalism Review AI 2023-11-06 18:27 UTC Score 18.0 AI-176-20231106-regional-ai--5c9429fc Full article

Gabo Foundation to host master class in Spanish on AI opportunities for investigative journalism

"The Gabo Foundation invites to a master class with journalist Emilia Díaz-Struck, executive director of the Global Investigative Journalism Network (GIJN), on Nov. 8. Díaz-Struck will explore artificial intelligence (AI) opportunities for investigative journalism, the editorial processes related to data management and advanced technology, as well as reporting and fact-checking. Challenges and risks related to […] The post Gabo Foundation to host master class in Spanish on AI opportunities for investigative journalism appeared first on LatAm Journalism Review by the Knight Center .

LatAm Journalism Review AI 2023-11-06 18:27 UTC Score 18.0 AI-176-20231106-regional-ai--322624c9 Full article

Gabo Foundation to host master class in Spanish on AI opportunities for investigative journalism

"The Gabo Foundation invites to a master class with journalist Emilia Díaz-Struck, executive director of the Global Investigative Journalism Network (GIJN), on Nov. 8. Díaz-Struck will explore artificial intelligence (AI) opportunities for investigative journalism, the editorial processes related to data management and advanced technology, as well as reporting and fact-checking. Challenges and risks related to […] The post Gabo Foundation to host master class in Spanish on AI opportunities for investigative journalism appeared first on LatAm Journalism Review by the Knight Center .

An Adaline neuron can solve problems that are not linearly separable?
AI Stack Exchange 2023-11-05 20:04 UTC Score 15.0 AI-110-20231105-social-media-7871d065 Full article

An Adaline neuron can solve problems that are not linearly separable?

https://en.wikipedia.org/wiki/ADALINE I was confused about this because, for example, the XOR problem is not linearly separable, and a simple Perceptron obviously cannot solve it, so we would need a network like the multilayer perceptron. Furthermore, some sources on the internet say that Adaline's learning algorithm, the LMS (Least Mean Squares) algorithm, converges to the minimum error assumption, regardless of whether the training data is linearly separable or not . However, this refers to minimizing MSE, not correctly classifying all training samples. But this leaves me confused. What does that mean? An Adaline neuron can solve problems that are not linearly separable ? If so, what is the difference between Adaline's ability to solve problems that are not linearly separable and other neural networks such as Madaline and multilayer perceptron?

Method of least squares, first order condition and QR decomposition
Cross Validated 2023-11-04 17:46 UTC Score 12.0 AI-113-20231104-social-media-daad025a Full article

Method of least squares, first order condition and QR decomposition

When you use the method of least squares you estimate the parameters in the following way: $$\min_{\mathbf{b}} (\mathbf{y} - \mathbf{X}\mathbf{b})^T(\mathbf{y} - \mathbf{X}\mathbf{b})$$ Where $\mathbf{y}_{n \times 1}$ , $\mathbf{X}_{n \times (p + 1)}$ and $\mathbf{b}_{(p+1) \times 1}$ If you solve the problem you obtain the following first order condition: $$\mathbf{X}^T\mathbf{X}\mathbf{b} = \mathbf{X}^T\mathbf{y}$$ According to R version 4.3.1 to find $\mathbf{b}$ QR decomposition is used (see ?lm in relation to method = "qr" ). Thefore we have that if $\mathbf{X}$ is of full column rank it can be expressed as $\mathbf{X} = \mathbf{QR}$ where $\mathbf{Q}$ is a orthogonal matrix with dimensions $n \times (p+1)$ and $\mathbf{R}$ is a upper triangular matrix with dimensions $(p + 1) \times (p + 1)$ . According to wikipedia ( here , here and here ) we have the following: $\mathbf{Q}\mathbf{Q}^T = \mathbf{Q}^T\mathbf{Q} = \mathbf{I}$ For $\mathbf{R}$ we have that $r_{ij} = 0$ for $i > j$ Then applying this to the first order condition we have that: $$\mathbf{X}^T\mathbf{X}\mathbf{b} = \mathbf{X}^T\mathbf{y}$$ $$(\mathbf{QR})^T\mathbf{QR}\mathbf{b} = (\mathbf{QR})^T\mathbf{y}$$ $$\mathbf{R}^T\mathbf{Q}^T\mathbf{QR}\mathbf{b} = \mathbf{R}^T\mathbf{Q}^T\mathbf{y}$$ $$\mathbf{Q}^T\mathbf{QR}\mathbf{b} = \mathbf{Q}^T\mathbf{y}$$ $$\mathbf{Rb} = \mathbf{Q}^T\mathbf{y}$$ $$\mathbf{b} = \mathbf{R}^{-1}\mathbf{Q}^T\mathbf{y}$$ Using the following reproducible example you can see that th…

Comparing the change in proportions across two time periods for two groups
Cross Validated 2023-11-02 14:56 UTC Score 9.0 AI-113-20231102-social-media-eb3b3d0a Full article

Comparing the change in proportions across two time periods for two groups

I am running a test across two groups over a period of time and want to understand if the Change in proportions for my test group is significantly different to the change in proportions in the control group. Most of what I have found compares one proportion to another either over group or over time but not both. If I have: my Test group with proportions P1 and P2 with sample N1 and N2 (in periods T1 and T2) my control group with proportions Q1 and Q2 with sample M1 and N2 (in periods T1 and T2) I want to know if P2-P1 is statistically significantly different to Q2-Q1 P1,P2,Q1, Q2 are all percentages. Any help would be most appreciated!

Cross Validated 2023-11-02 09:58 UTC Score 9.0 AI-113-20231102-social-media-ec6fe34c

Why doesn't estimating Shannon entropy with a histogram converge to its true value?

I'm following the third recipe of this answer to estimate the Shannon entropy of my samples using histograms. My expectation was, increasing the sample size should lead to a better estimation of the true entropy. To test that, I sampled from a Gaussian distribution $N(0, \sigma^2)$ with known entropy $H(X) = 0.5[1 + \log(2\pi \sigma^2)]$ : import numpy as np from scipy.stats import entropy # by default in natural log import matplotlib.pyplot as plt sigma = 2 H0 = 0.5*(1 + np.log(2*np.pi*sigma**2)) # theoretical value in nats Hs = [] ns = np.logspace(2,6,5, dtype=int) for n in ns: X = np.random.normal(0, sigma, size=n) nbins = int(n/20) # To my surprise, they diverge: Am I missing something very simple? I found a relevant question that is concerned about the case where the probability distribution is either "peaked" or "flat". The upshot of the most voted answer is that one has to normalize the entropy by $\log n$ where $n$ is the number of samples. Although I find this normalization sensible, I still observe an offset between the theoretical value and the estimation: plt.plot(ns, np.array(Hs)/np.log(ns), '-x', label='normalized estimation') # normalized What causes this discrepancy? As @sextus-empiricus noted below, scaling the number bins with the sample size leads to a coarse density estimation. In fact, fixing the number of bins, resolves the divergence . However, no matter what number of bins one chooses, there's still some offset between the estimated (normalized or non…

Anyscale Blog 2023-11-01 00:00 UTC Score 38.0 USR-0085-20231101-ai-specialis-1603991d Full article

Reproducible Performance Metrics for LLM inference

Update June 2024: Anyscale Endpoints (Anyscale's LLM API Offering) and Private Endpoints (self-hosted LLMs) are now available as part of the Anyscale Platform. Click [here](https://console.anyscale.com/?utm_source=anyscale&utm_medium=blog&utm_campaign=blog_callout&utm_content=june2024_product_update_subheading) to get started on the Anyscale platform.

Cross Validated 2023-10-29 07:52 UTC Score 21.0 AI-113-20231029-social-media-613816b5

Sufficient/complete statistic $\leftrightarrow$ injective/surjective map?

I can't understand the paragraph in Completeness (statistics) - Wikipedia : We have an identifiable model space parameterised by $\theta$ , and a statistic $T$ . Then consider the map $f:p_{\theta }\mapsto p_{T|\theta }$ which takes each distribution on model parameter $\theta$ to its induced distribution on statistic $T$ . The statistic $T$ is said to be complete when $f$ is surjective, and sufficient when $f$ is injective. ( added on 2023-07-12 without any citation, and there's no revision after that) What does “ distribution on $\theta$ ” mean? Domain of $f$ is all prior distribution of $\theta$ (in Bayesian sense), or the famliy of distributions of samples ( $X_1, \ldots, X_n$ )? What is the codomain of $f$ ? I guess the image of $f$ is all possible distribution of $T$ (i.e. the famliy of distributions of $T$ ), but codomain should be larger than that, or $f$ is always surjective. My thoughts Sufficiency and completeness are related but independent concepts, as discussed in the following questions. If the statement in Wikipedia is true, then it’s a clear explanation of sufficiency and completeness. exponential family - Are complete statistics always sufficient? - Cross Validated Is a minimal sufficient statistic also a complete statistic - Cross Validated Roughly speaking: $T$ is sufficient : $T$ provides all information of $\theta$ from $X$ , and we can recover the whole distribution of $X$ once given $T$ . $f$ is injective : If we know that $y$ is $f$ of some $x$ , the…

Lilian Weng Blog 2023-10-25 00:00 UTC Score 48.0 USR-0112-20231025-ai-specialis-81866df8 Full article

Adversarial Attacks on LLMs

The use of large language models in the real world has strongly accelerated by the launch of ChatGPT. We (including my team at OpenAI, shoutout to them) have invested a lot of effort to build default safe behavior into the model during the alignment process (e.g. via RLHF ). However, adversarial attacks or jailbreak prompts could potentially trigger the model to output something undesired. A large body of ground work on adversarial attacks is on images, and differently it operates in the continuous, high-dimensional space. Attacks for discrete data like text have been considered to be a lot more challenging, due to lack of direct gradient signals. My past post on Controllable Text Generation is quite relevant to this topic, as attacking LLMs is essentially to control the model to output a certain type of (unsafe) content.

UN AI Advisory Body 2023-10-24 16:36 UTC Score 29.0 USR-0162-20231024-company-offi-f2b8419b Full article

Third United Nations Conference on Landlocked Developing Countries (LLDC3)

Third UN Conference on Landlocked Developing Countries Awaza, Turkmenistan 5-8 August 2025 Driving Progress through partnerships The United Nations General Assembly (UNGA) decided to convene the Third United Nations Conference on Landlocked Developing Countries (LLDC3) from 5-8 August in Awaza, Turkmenistan at the highest possible level, including Heads of State and Government, on the theme “Driving progress through partnerships”. Stakeholder Participation in the Conference: As guided by resolution A/RES/77/246 , other relevant stakeholders, including the non-governmental organizations, civil society organizations, academic institutions and the private sector whose work is relevant to the Conference are invited to participate as observers in the Conference and its preparatory meeting. For additional information, please visit the Conference website: 3rd UN Conference on Landlocked Developing Countries (LLDC3) Relevant stakeholders who have received special accreditation to any of the conferences and summits listed below (check the consolidated list here ) may participate in the conference by following the REGISTER NOW link here . The registration deadline is 12 July 2025. The Global Conference on the Sustainable Development of Small Island Developing States The International Meeting to Review the Implementation of the Programme of Action for the Sustainable Development of Small Island Developing States The third International Conference on Small Island Developing States The f…

AI Stack Exchange 2023-10-17 22:05 UTC Score 12.0 AI-110-20231017-social-media-ea851c9d Full article

Unclear points in scaled Euclidean distance

The following is from a machine learning book. I did not understand the explanation given in the figure caption. Could some expert make it clear? Why is the stretching class-dependent for the center case?

Cross Validated 2023-10-17 12:53 UTC Score 26.0 AI-113-20231017-social-media-2f4101b7

lme models yielding different coefficients for the same fixed effect but different random effects

I'm doing a linear mixed model. I have six repeated measures of subjects which correspond to different time's instants of some dependent variables. Using the lme function of the nlme package in R, I've fitted two linear mixed models with one fixed effect, one using the time variable as a random effect, and another using the IDs as a random effect variable. So that: model_1 However, I find that the two models differ in the coefficient estimates, those still remaining very similar. Particularly, the coefficients of the first model, the one with time as random effect, corresponds to the mean of the observations within each times as in the original dataset. However, when modelling ID as a random effect, I don't find these estimates to be the same. I'm a bit perplexed by this and would greatly appreciate some guidance on understanding this behavior.

Neural algorithmic reasoning
The Gradient 2023-10-14 15:30 UTC Score 13.0 AI-037-20231014-ai-specialis-f4364e5c Full article

Neural algorithmic reasoning

In this article, we will talk about classical computation : the kind of computation typically found in an undergraduate Computer Science course on Algorithms and Data Structures [1]. Think shortest path-finding, sorting, clever ways to break problems down into simpler problems, incredible ways to organise data for efficient retrieval and updates.

Loading Llama-2 70b 20x faster
Anyscale Blog 2023-10-11 00:00 UTC Score 39.0 USR-0085-20231011-ai-specialis-2a4bfb21 Full article

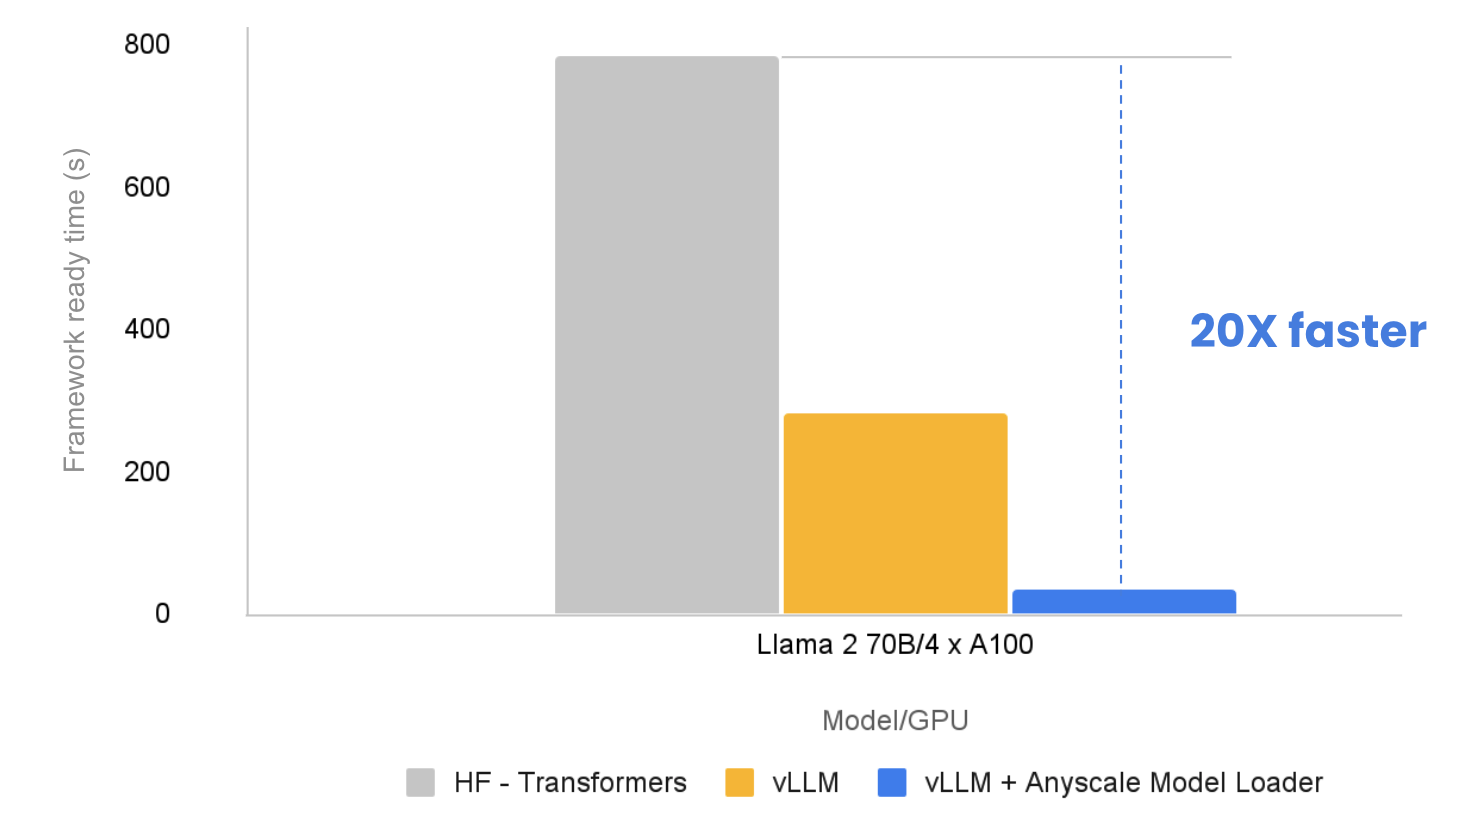
Loading Llama-2 70b 20x faster

In this post, we discuss the importance of speed when loading large language models and what techniques we employed to make it 20x faster. In particular, we use the Llama 2 series of models. We share how you can reduce latency and costs using the Anyscale platform.

Chip Huyen Blog 2023-10-10 00:00 UTC Score 53.0 USR-0111-20231010-ai-specialis-f4a68771 Full article

Multimodality and Large Multimodal Models (LMMs)

For a long time, each ML model operated in one data mode – text (translation, language modeling), image (object detection, image classification), or audio (speech recognition). However, natural intelligence is not limited to just a single modality. Humans can read, talk, and see. We listen to music to relax and watch out for strange noises to detect danger. Being able to work with multimodal data is essential for us or any AI to operate in the real world. OpenAI noted in their GPT-4V system card that “ incorporating additional modalities (such as image inputs) into LLMs is viewed by some as a key frontier in AI research and development .” Incorporating additional modalities to LLMs (Large Language Models) creates LMMs (Large Multimodal Models). Not all multimodal systems are LMMs. For example, text-to-image models like Midjourney, Stable Diffusion, and Dall-E are multimodal but don’t have a language model component. Multimodal can mean one or more of the following: Input and output are of different modalities (e.g. text-to-image, image-to-text) Inputs are multimodal (e.g. a system that can process both text and images) Outputs are multimodal (e.g. a system that can generate both text and images) This post covers multimodal systems in general, including LMMs. It consists of 3 parts. Part 1 covers the context for multimodality, including why multimodal, different data modalities, and types of multimodal tasks. Part 2 discusses the fundamentals of a multimodal system, using the…

How to deal with a Stationary DV and a Trend-Stationary IV in using OLS?
Cross Validated 2023-10-08 04:39 UTC Score 9.0 AI-113-20231008-social-media-de1e9c72 Full article

How to deal with a Stationary DV and a Trend-Stationary IV in using OLS?

I have a dependent variable that is stationary in levels. However, one of the IVs is only trend-stationary (stationary around a deterministic trend that I can extract from the series). In other words, I have a regression with variables that have different transformations. My question is, does this bias the significance of the results, including the significance of any other IVs (that are stationary in levels in the regression)? If not, it is probably reasonable to assume that it biases the estimated coefficient of the DP on the trend-stationary IV but not the significance of the effect since it shouldn't impact the standard errors (due to the trend being deterministic). Is that an accurate assessment? Also, what if I detrend (i.e. extract a deterministic trend) from my stationary DV? Is this equivalent to over differencing and thus losing important information from the series? Does extracting a deterministic trend from a stationary series even make sense?

The Artificiality of Alignment
The Gradient 2023-10-07 16:00 UTC Score 19.0 AI-037-20231007-ai-specialis-bd099ece Full article

The Artificiality of Alignment

This essay first appeared in Reboot . Credulous, breathless coverage of “AI existential risk” (abbreviated “x-risk”) has reached the mainstream. Who could have foreseen that the smallcaps onomatopoeia “ꜰᴏᴏᴍ” — both evocative of and directly derived from children’s cartoons —

How to calculate correlation coefficient for data with repeated values in one variable?
Cross Validated 2023-10-05 17:30 UTC Score 9.0 AI-113-20231005-social-media-afc99029 Full article

How to calculate correlation coefficient for data with repeated values in one variable?

I want to measure the strength of the linear relationship between gene expression and a phenotypic variable for a number of species. However, I only have gene expression values at the species level, not for each individual, meaning the expression values are repeated. The plot below shows some representative (fake) data for three species. Some more background: the phenotypic variable we're measuring is the response to an antibody-targeted compound, and the antibody should be binding to a specific gene product. We therefore want to measure whether the expression of that gene in a species is correlated with the observed effect of the compound, since that will tell us the degree to which the targeting of the compound by the antibody matters. My questions are: Is a Pearson correlation appropriate for data like this with many repeated values? If not, why exactly? I think the answer is no but I can't quite say why. If Pearson correlation is not appropriate, what is one other analysis that could measure the strength of the linear relationship between the two variables that takes into account the repeated values?

AI Stack Exchange 2023-10-04 07:04 UTC Score 21.0 AI-110-20231004-social-media-8782614f Full article

How to force Transformer to give more weight to certain tokens

I'm developing an encoder-decoder based transformer model and I would like to ask if there are ways to incentivize or penalize certain tokens during training. I'm working on a translation task where the encoder input must be decoded into its proper product name. I have labels such as brand, name, and unit of measure, etc which are available during training but not on inference. Currently when predicting the brand portion (which usually appears early in the sequence) of the output, the heatmap shows that it does not give focus to the latter part of the encoder which produce an output that the brand and product name, and unit of measure does not belong to each other. I was thinking if there's a way to force the transformer during training to give more weight to different token types other that its own. For example: Brand tokens (decoder) should give more weight to name tokens (encoder) than other brand tokens (encoder) Name tokens (decoder) should give more to brand token (encoder) and unit of measure token (encoder)

Cross Validated 2023-10-02 05:40 UTC Score 23.0 AI-113-20231002-social-media-f73041b8

Creating a CNN model for multi-output prediction where one target variable is categorical, and others are numeric

I want to create a simple CNN model for multi-output prediction. The predicted values are four numeric values (all between 0-1) and one categorical value (4 classes). When I try to create a model using Keras, I cannot predict numeric and categorical values using one model. I use a workaround for a categorical variable, where I one-hot-encode it and predict one-hot-encoded values. What would be the right approach for multi-output prediction, where the predicted values are categorical and numeric; How do I change the code to use the Categorical Cross entropy loss function and argmax to predict the categorical output variable (simultaneously with other numerical output variables)? from tensorflow.keras.utils import to_categorical from tensorflow.keras.preprocessing.image import ImageDataGenerator from tensorflow.keras import layers import tensorflow.keras as keras import pandas as pd def baselineCNNModel(train_df, test_df, OUTPUT_DIR_TRAIN, OUTPUT_DIR_TEST, debug = False): """ Create a baseline CNN model for multi-output prediction. The input is full images (containing one or more road signs). The target prediction values are class labels and bounding box information. """ print("\nrunSimpleModel\n") train_dataset = train_df[['Class Number', 'Center in X', 'Center in Y', 'Width', 'Height', 'Image Filename']] test_dataset = test_df[['Class Number', 'Center in X', 'Center in Y', 'Width', 'Height', 'Image Filename']] train_class_number_labels_one_hot = to_categorical(train_dataset[…

Anyscale Blog 2023-09-25 00:00 UTC Score 35.0 USR-0085-20230925-ai-specialis-41b9c387 Full article

Ray Serve: Tackling the cost and complexity of serving AI in production

Announcing Ray Serve and Anyscale Services general availability. Update June 2024: Anyscale Endpoints (Anyscale's LLM API Offering) and Private Endpoints (self-hosted LLMs) are now available as part of the Anyscale Platform. Click [here](https://console.anyscale.com/?utm_source=anyscale&utm_medium=blog&utm_campaign=blog_callout&utm_content=june2024_product_update_subheading) to get started on the Anyscale platform.

Why does the policy gradient theorem have two different forms?
AI Stack Exchange 2023-09-23 01:36 UTC Score 15.0 AI-110-20230923-social-media-a52f5eca Full article

Why does the policy gradient theorem have two different forms?

I have been studying policy gradients recently but found different expositions from different sources, which greatly confused me. From the book "Reinforcement Learning: an Introduction (Sutton & Barto Chapter 13)", we get the following policy gradient: $$ \nabla J(\theta) = \mathbb E_\pi\left[G_t\nabla\log\pi(A_t | S_t, \theta)\right]. $$ As we can observe from the equation, it does not relate to trajectory distributions . However, a more intuitive and widely-used introduction to policy gradient starts from defining the distribution of trajectories: $p(\tau)$ . For example, in OpenAI Spinning Up , the policy gradient has the form similar to the following equation: $$ \nabla J(\theta) = \mathbb E_{\tau \sim \pi}\left[\sum_{t=0}^{T}G_t\nabla_\theta\log\pi_\theta(a_t | s_t)\right]. $$ The confusion comes from the fact that the first policy gradient does not have a summation over timestamps and is not sampling from trajectories, but the second samples from trajectories and has a summation. I did find some relevant questions about this confusion, but none of them seemed to have a good answer. Also, I could not identify any source that explained the difference/connection between the two forms. My question is why are there two different ways to describe the policy gradient and are the two forms mathematically equivalent? Update I found a great RL theory book (draft) written by some expert Professors in this field that shows two different formulations: https://rltheorybook.github.io…

UN AI Advisory Body 2023-09-21 22:14 UTC Score 22.0 USR-0162-20230921-company-offi-d5ff71b3 Full article

#UNGA78 - Wrap Day 4

Groups audience: General Assembly 78 Live Blog Video embed a la iseek:

UN AI Advisory Body 2023-09-21 21:57 UTC Score 32.0 USR-0162-20230921-company-offi-55e59e3f Full article

Until we meet again

In a few days, world leaders will head back to capitals and barricades will be dismantled, but the General Assembly keeps working. Global threats don’t stop at the end of the high-level week, and neither does the search for responses. Countries continue grappling with the problems affecting us all: from the outer reaches of space to the seabed floor. And while this blog comes to a close, there’s always time to open our many platforms from websites to social media to the UN News App. مع السلامة 再见 See you later Au revoir До свидания Adios Groups audience: General Assembly 78 Live Blog

UN AI Advisory Body 2023-09-21 21:55 UTC Score 22.0 USR-0162-20230921-company-offi-2f08a10b Full article

last day

Groups audience: General Assembly 78 Live Blog