last day
Groups audience: General Assembly 78 Live Blog
AI/ML news, top picks, and generated innovation digests.
28226 matching items
Groups audience: General Assembly 78 Live Blog
Christian Dior designed the iconic UN tour guide uniforms in the early 1980s. Prior to that, designers included Edith Head and, for the UN’s first male tour guides, Brooks Brothers. The guides got a fashion refresh in 1985 by Harvé Benard, then changed their uniforms, courtesy of Benneton, and Mondrian. Image: Groups audience: General Assembly 78 Live Blog
Vice-President of China, Han Zheng, said in his speech to the GA said: "China supports all efforts that are conducive to the peaceful resolution of the Ukraine crisis, and stands ready to continue playing a constructive role for the early attainment of peace." Image: Groups audience: General Assembly 78 Live Blog
"Since 15 April, Sudanese people have been facing a destructive war launched by rebel RSF," said Abdel-Fattah Al-Burhan Abdelrahman Al-Burhan, President of the Transitional Sovereign Council of Sudan. "We call upon the international community to designate these groups and their allies as terrorist groups to be countered by arms and fought to protect Sudan, region and the entire world." Image: Groups audience: General Assembly 78 Live Blog
Happening now at the SDG Media Zone: Johan Santana, young innovator who codes to address SDG 3 and 10 (speaking). He expresses his desire to assist individuals with visual impairments and other disabilities. They've developed a hands-free blind cane and smart glasses and will work on coding a wheelchair capable of moving in all directions: forward, backward, left, and right. Also in the picture: Michael Melillo, Sr. Director of Network Monitoring and Management Software Products, Broadcom Inc.(left) Bervin Harris, Renaissance Youth Center (second from left). Image: Groups audience: General Assembly 78 Live Blog
Michael Lodge (Secretary General, International Seabed Authority) and Emilie McGloane (Director, Peace Boat US) met at the SDG Media Zone to discuss the importance of a new historic treaty - the Treaty of the High Seas - which protects biodiversity beyond national jurisdiction (often shortened to BBNJ). Michael Lodge emphasized the vastness of oceans and said that “1% of oceans contain more minerals than exist on land”. He continued: "Good regulation is important to ensure that the ocean’s resources are not exploited". So far, some 60 UN Member States have signed onto the treaty since its opening this week at UNGA78. Image: Groups audience: General Assembly 78 Live Blog
The Renaissance Youth Center choir visits the SDG Media Zone for a session on creative problem-solving and coding for the SDGs. The session explores the passion and enthusiasm of today’s youth to solve the challenges they face through creativity in STE(A)M and showcases successful outcomes when the private sector joins forces with NGOs to educate, inspire and empower youth as future STEM leaders in their communities and the world. Image: Groups audience: General Assembly 78 Live Blog

I've been studying diffusion models and came across the noise schedule, particularly how the noise variance $\beta_t$ is adjusted over iterations. I've observed that $\beta_t$ typically starts from a very small value during the initial steps and increases to a much larger value in the final steps. What is the underlying reason for this progression? Why is it important to begin with a low noise variance and end with a high one? I'd appreciate any intuitive explanations or references that shed light on this choice.
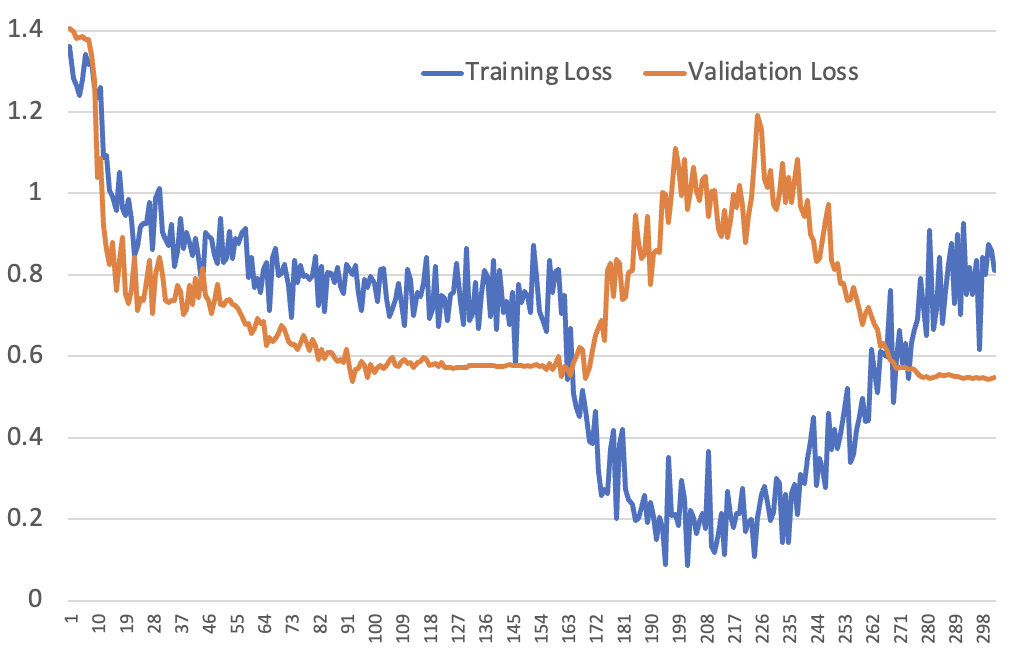
We’ve noticed an unusual training pattern in fine-tuning LLMs. At first we thought it’s a bug, but now we think it shows LLMs can learn effectively from a single example.
I'm asking specifically about ChatGPT4, but the question could apply to either that or 3.5. When you use the ChatGPT API, it's of course up to you to manage conversation history and include that in successive API calls within available context length in whatever manner you choose. In the case of the web interface, they've obviously implemented some system to manage conversation history in context. It clearly doesn't "remember" the entire thing once the conversation gets very long, because it doesn't have infinite context length. So, what strategy does it use to send conversation history to the model once it's exceeded its context length? Does it truncate all content prior to the max context length? Does it summarize earlier parts of conversations to more efficiently fit them within the context? Does it do some dynamic strategy combining many inputs? Or is this just another case where we just don't know, and OpenAI is being tight-lipped about what it's actually doing?

I'm trying to evaluate whether the difference in uplift seen in below table between the test groups and the control group is statistically significant. I'm unsure about the appropriate statistical test. The test and control groups are all of different sizes already before the test, which is why I have included the relative numbers. I first thought about the chi-square test, but that don't think it captures the pre- & post-treatment aspect correctly. For context: Four different geographic regions were selected, one of them as control. Each test region received a different mix of marketing measures with the goal to raise awareness. I am now trying to evaluate whether the uplift in the test regions is statistically different from the control region. Control Group 1 Group 2 Group 3 Number of visitors (pretest) 59800 9993 19284 17876 Number of visitors (posttest) 65993 11781 23373 20883 Relative Change +10.36% +17.89% +21.20% +16.82% Which statistical test would be needed to find an answer to my question? Thank you very much. Edit: The below table shows the weekly visitors by test group. Week 23 to 28 are pre-treatment, week 29 to 34 are post-treatment. Control Group 1 Group 2 Group 3 Week 23 8590 1492 2929 2837 Week 24 9217 1588 3138 2846 Week 25 9534 1599 2992 2812 Week 26 10213 1714 3440 3005 Week 27 10435 1704 3187 2987 Week 28 10932 1817 3180 3234 Week 29 11489 1948 3566 3159 Week 30 10936 1974 3707 3273 Week 31 11856 2061 3885 3609 Week 32 10621 1851 3926 3586 Week 33 9905…
I have two time series and I computed the percentage change like: (Value at time2)/(Value at time1) - 1 My doubt is on the correlation of the original time series and the percentage change time series. The correlation for the original time series is -0.2 while for the percentage change is 0.22. My question is just on a theoretical level: is it possibile to have opposite relationships between the two pairs of time series? How should I interpret this opposite behavior of the two couple of time series?
I'm working with data from an experiment that I plan to analyze using a mixed-effects logistic model. In this study, 200 participants (identified by the variable Participant) were randomly assigned to one of four experimental conditions (variable: Condition). Within each condition, participants were tasked with determining whether a given word (variable: Word) could appropriately conclude a sentence (variable: Sentence). We used a set of 30 unique words, and each participant had to evaluate all of them. For each word, participants were presented with two sentences: one where the word could correctly be used at the end (variable: Appropriateness = 'Yes') and another where it could not (variable: Appropriateness = 'No'). Participants earned a point (variable: score) for each correct judgment they made. I would appreciate any advice on how to best approach the statistical analysis of this data using mixed-effects models. Here's what I've been considering: Model 1: score ~ Condition * Appropriateness + (1|Participant) + (1|Word) Model 2: score ~ Condition * Appropriateness + (1|Participant) + (1|Sentence/Word) Model 3: score ~ Condition * Appropriateness + (Appropriateness|Participant) + (Appropriateness|Sentence/Word) As you can see, my particular concern is related to specifying the random effects. Please share your thoughts or suggestions on which model might be the most appropriate for this type of data.
[ LinkedIn discussion , Twitter thread ] Never before in my life had I seen so many smart people working on the same goal: making LLMs better. After talking to many people working in both industry and academia, I noticed the 10 major research directions that emerged. The first two directions, hallucinations and context learning, are probably the most talked about today. I’m the most excited about numbers 3 (multimodality), 5 (new architecture), and 6 (GPU alternatives). 1. Reduce and measure hallucinations Hallucination is a heavily discussed topic already so I’ll be quick. Hallucination happens when an AI model makes stuff up. For many creative use cases, hallucination is a feature. However, for most other use cases, hallucination is a bug. I was at a panel on LLM with Dropbox, Langchain, Elastics, and Anthropic recently, and the #1 roadblock they see for companies to adopt LLMs in production is hallucination. Mitigating hallucination and developing metrics to measure hallucination is a blossoming research topic, and I’ve seen many startups focus on this problem. There are also ad-hoc tips to reduce hallucination, such as adding more context to the prompt, chain-of-thought, self-consistency, or asking your model to be concise in its response. To learn more about hallucination: Survey of Hallucination in Natural Language Generation (Ji et al., 2022) How Language Model Hallucinations Can Snowball (Zhang et al., 2023) A Multitask, Multilingual, Multimodal Evaluation of ChatGPT…
Background | Classifier-Free Guidance Derivation To summarize the derivation of Classifier-Free Guidance, looking at this paper (Page 21.), we can write classifier guidance as: $$\nabla_{x}\log p\left(x_{t}\mid y\right) =\nabla_{x}\log\left(\frac{p\left(x_{t}\right)\cdot p\left(y\mid x_{t}\right)}{p\left(y\right)}\right) =\nabla_{x}\log p\left(x_{t}\right)+\nabla_{x}\log p\left(y\mid x_{t}\right)-\nabla_{x}\log p\left(y\right) =\nabla_{x}\log p\left(x_{t}\right)+\nabla_{x}\log p\left(y\mid x_{t}\right)$$ and we can amplify the guidance by adding a factor $\gamma$ : $$\nabla_{x}\log p\left(x_{t}\mid y\right)=\nabla_{x}\log p\left(x_{t}\right)+\gamma\cdot\nabla_{x}\log p\left(y\mid x_{t}\right)$$ Then to derive classifier-free guidance all we do is rewrite the first equation we saw: $$\nabla_{x}\log p\left(y\mid x_{t}\right)=\nabla_{x}\log p\left(x_{t}\mid y\right)-\nabla_{x}\log p\left(x_{t}\right)$$ and substitue it into the 2nd equation we saw to get $$\nabla_{x}\log p\left(x_{t}\mid y\right)=\nabla_{x}\log p\left(x_{t}\right)+\gamma\cdot\left(\nabla_{x}\log p\left(x_{t}\mid y\right)-\nabla_{x}\log p\left(x_{t}\right)\right)$$ and this is classifier-free guidance. We can also rewrite it to be $$\nabla_{x}\log p\left(x_{t}\mid y\right)=\gamma\cdot\nabla_{x}\log p\left(x_{t}\mid y\right)-\left(\gamma-1\right)\cdot\nabla_{x}\log p\left(x_{t}\right)$$ The Question It seems reasonable to me that as we can amplify and play with the guidance factor, we could also add a factor $\be…
Intro: I have dropped math since high school, therefore I am trying to describe my question in layman's terms. Please forgive me for not typing the convention notations. I even do not know what is the correct term to put in the Google search bar for doing research. Therefore, any suggestion is greatly appreciated. Scenario : Imagine I am doing a field study to record the number of animals in a field. It is impossible to count everything, and I am going to sample a 1 km2 area. It is assumed that the number of my observation is depending on the following 3 variables (for simplicity): Underlying number of that animal. Whether the animal is active (i.e. how often they "appear" or "come" to the sample area). The length of time I perform the observation. The second point is relevant because I am not able to distinguish individual animals, therefore, if the same animal comes to the area twice, I will just count twice and assume they are not the same. However, I do assume that it is less likely to count the same animal if it is less active (see distributions 5 & 6 below). The third point is relevant because I am going to film the area for 10 minutes (as an example). Assuming I will look at the video many times and am able to count everything, the observed count will be higher if I lengthen the observation period (so that both less active and abundant animals might also go into the field for counting). Assuming I counted 100 different fields (exp1), I am now having a dataset as a cou…
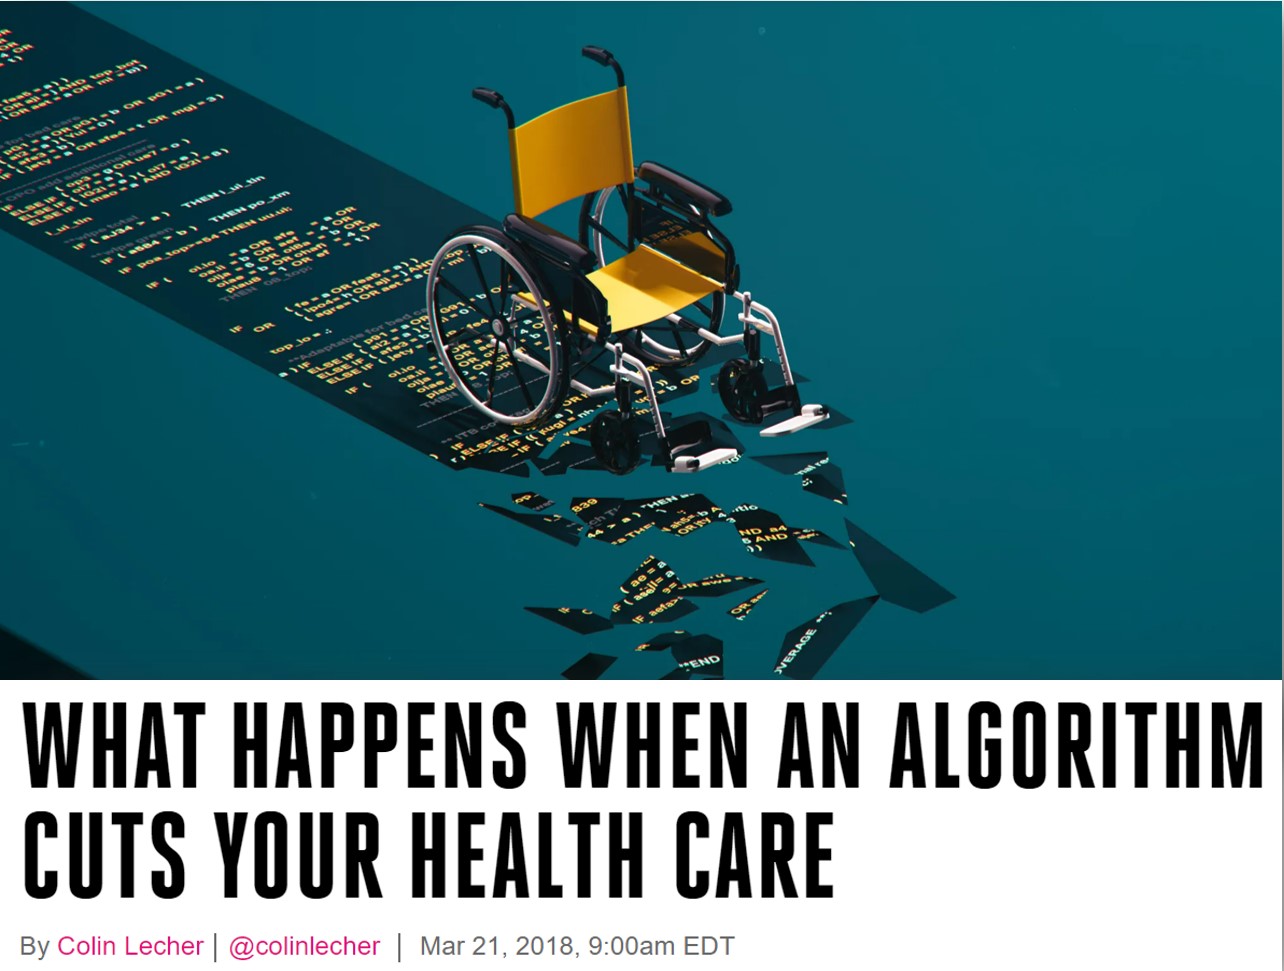
Moving AI ethics beyond explainability and fairness to justice

I have observations from three groups of participants (A, B, C), that each represent ratings on three different measures (measure 1, 2, and 3). I would like to know if it is the case that, regardless of group, the distance between measure 3 and measure 2 is greater than the distance between measure 3 and measure 1. In STATISTICA, I'd have defined a mixed-model ANOVA with group as between subjects factor and "measure" as a repeated measures factor, defined an appropriate contrast, and then run a significance test on that contrast. I would now like to answer that question not in a GUI-based software like STATISTICA, but instead based on a posthoc pairwise test done on the output of a linear mixed model, conducted in MATLAB. However, after reading the documentation for fitlme and multcomp , I am left confused as to how to go about answering my question. I also don't really remember how that contrast vector should have been defined in STATISTICA, assuming something like this will be needed in the LMM also. An answer that replaces MATLAB with Python or R will be fine, as it should be easy for me to translate between them.
I am really confused regarding 2-way Anovas. I think I did not understand something properly. Let's say I have a 2x2 experiment design with 2 factorial variables (For the sake of an example let's say Letter and Number so A1, A2, B1, B2 as possible combinations) I would like to do a 2-way Anova since I hypothesise an Interaction between the variables Number and Letter. However, the sample sizes per group are quite small, unbalanced (n = 4-6) and not paired. As part of my experiment design I have 4 planned comparisons: A1 - A2, B1 - B2, A1 - B1, A2 - B2 Now two questions: As far as I understand I have two orthogonal contrasts? These are the simple main effects or are they interactions? After the Anova I can NOT do a post-hoc test (because I have planned comparisons and not testing opertunistic?). So I would only test my planned comparison with a t-test with a correction for multiple comparisons (since I am doing more than 3 comparisons). 3. Which t-test should I do (pairwise, two-sample, or not a t-test at all)? 4. Am I doing the planned comparisons regardless of the significance of the Anova? 4.5 . But If so why am I doing the Anova in the first place? 5. Is it okay to just do a t-test with correction, without the Anova? I looked at the following cross validation questions, but I am sill confused understand: Calculating 'k' in the bonferroni procedure when there are both post-hoc and planned constrasts Is it appropriate/acceptable to do planned comparisons for data that will…
I am using R. I have a data set with a binary (0,1) response and both continuous and categorical predictors. I would like to test the overall importance of these predictors one by one, and I am looking for suggestions on how to do this. I am not trying to select an overall model yet. I am just trying to see which variables are individually significantly associated to the response. Here is an example concerning categorical variables ... Let's call the response "y". Let's say my categorical predictor is called "xCat" and has levels A, B, C, and D. I would like to test if xCat has a statistically significant association with y. I want to test for overall significance, not just significant differences from a single reference group. Here is what I have tried so far ... Option A using LRT: fitCat Option B using drop1: fitCat I would then look at p-values for either of these outputs. If the p-value is >0.05, then I would say there is not significant association. Is this actually testing what I think it is testing? I am concerned about violating assumptions of normality and equal variance for the ANOVA. Any comments or suggestions? Here is an example of the continuous predictors... Let's call the continuous predictor "xCon". Here is what I've tried ... fitCon I would then look at the p-value from the output. If the p-value is >0.05, then I would say there is not significant association. Is there anything I'm missing here? assumptions I need to check or common pitfalls? Let me know i…
I was playing around with MobileStyleGAN pretrained model and multithreading and came along with an interesting phenomenom. After a while application is running MobileStyleGAN starts to produce video clip alike pieces. And I am wondering does anyone have an idea what takes? I made this lengthy video for it where you can see since it looks cool; https://youtu.be/8kpxHZK1NTQ Here's the source code used in the video if it's any help; https://github.com/harism/i_style_gan
I am trying to fine-tune Llama model on two task at the same time, using hugging face library: Main task: Causal language model like the model was initially trained for A classification task based on the whole input sequence (recommend an article). For this task I am getting as a reference the LlamaForCausalLM class, overwriting init and forward functions . However, I want to combine the two tasks above into one process. The main problem is that language modelling is an iterative process were the loss is calculated for every new context token in the input sequence, while for the classification task the loss should only be calculated once. How can I freeze the loss update on the classification task up and only calculated once the language modelling part has been completed. Is there any example you can recommend in order to combine a main LM task with an auxiliary classification task? First question for me here, thanks everyone for your understanding.
The example is trying to predict wether coffe is well roasted or badly. 1 is good roasted and 0 is bad. The architecture is: Now I try to visualize the model. Unit 1 has higher values when the duration of roasting is too little. Unit 2 has higher values for bad combinations of temperature and time. The blue-hatched regions show the layer outputted higher activations for the respective unit. I used a threshold of 0.5 So I can conclude higher activations from layer 1 give an output class of 0. But as I used the sigmoid activation function I thought that large values give an output class of 1. And very small values give a 0, due to the S-shape.
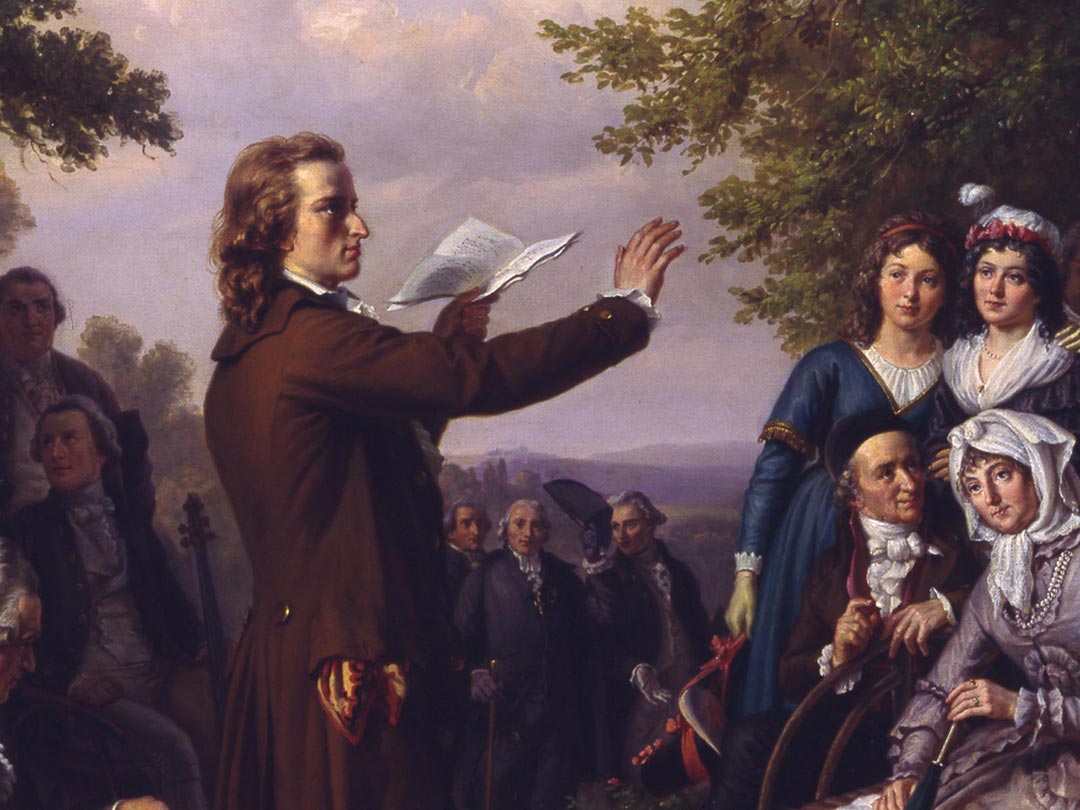
Model licensing & surveillance will likely be counterproductive by concentrating power in unsustainable ways
I know in order to shrink or expand the number of channels a 1x1 convolution is performed. I need to clarify the following: is the 1x1 convolution(s) just a matrix multiplication between the image with shape (h w, 3) (RGB) and a matrix that holds the learnable weights with shape (3, 1)? Which will result in a new matrix of shape (h w, 1) (in this case the number of channels shrunk from 3 to 1). If the above is correct, what happens under the hood of a NN framework, such as PyTorch, when the number of input channels is equal to the number of output channels? Does a matrix multiplication take place between the input (h*w, 3) and a matrix with learnable weights (num_channels, num_channels)? Doesn't this introduce unnecessary (and unwanted) operations?
Let Y be a vector of observations. A Gaussian Mixure Model (GMM) is fit to the dataset. The distribution can appear unsymmetrical, with different thickness of tails in both sides. What is the best way to find an optimal estimation for a confidence interval (e.g. $1-\alpha$ )? The goal is to identify the less probable observations. An straightforward solution would be to determine a threshold or a cutoff value for likelihood/probability below which a data point will be considered less probable. However there is no domain knowledge to judge this. I look for a Confidence Interval. I tried to find the bounds by optimizing the problem based on area under the curve. The solution is not the best due to unsymmetry and I assume The optimal CI should be the shortest interval too?! What is the best way to do that? Example of the fitted gaussians and the estimated PDF
I would like to find out if there is any impact of social media on the creation of entrepreneurial opportunities for entrepreneurs. I have two groups (Online Business and traditional Business) and 20 statements in total that I have measured using a 5 point Likert scale (strongly agree, agree, neutral, disagree, strongly disagree; and also not applicable, as suggested by my supervisor). Those who run traditional business chose "not applicable" for a lot of statements and I am now perplexed how to deal with this not applicable option! They are not missing values so I cannot ignore them as they bear important information about the traditional business group. My supervisor told me that I cannot even score this as 0 or 6. I am using R and R ignores not Applicable option while calculating correlation and even for other calculations as well. Moreover, I tried factor analysis but this "not applicable" option is creating problems in every step. I am new to deal with Likert scales and confused how to proceed with my data to figure out the answer of my research question.
Excellent documents for Research and Development
We are in a regression setting. Let's start by defining some notation and terminology. $y_i$ is observation $i$ of some (response) variable $Y$ . $\hat{y}_i$ is the value of $y_i$ predicted by a regression. $\bar{y}$ is the average of all observations of $Y$ . $$ y_i-\bar{y} = (y_i - \hat{y_i} + \hat{y_i} - \bar{y}) = (y_i - \hat{y_i}) + (\hat{y_i} - \bar{y}) $$ $$( y_i-\bar{y})^2 = \Big[ (y_i - \hat{y_i}) + (\hat{y_i} - \bar{y}) \Big]^2 = (y_i - \hat{y_i})^2 + (\hat{y_i} - \bar{y})^2 + 2(y_i - \hat{y_i})(\hat{y_i} - \bar{y}) $$ $$SSTotal := \sum_i ( y_i-\bar{y})^2 = \sum_i(y_i - \hat{y_i})^2 + \sum_i(\hat{y_i} - \bar{y})^2 + 2\sum_i\Big[ (y_i - \hat{y_i})(\hat{y_i} - \bar{y}) \Big]$$ $$ SSRes := \sum_i(y_i - \hat{y_i})^2 $$ $$ SSReg := \sum_i(\hat{y_i} - \bar{y})^2 $$ $$ Other = 2\sum_i\Big[ (y_i - \hat{y_i})(\hat{y_i} - \bar{y}) \Big] $$ The interpretation of the $SSRes$ seems straightforward enough, just the sum of the squared differences between the predicted and the true values. Why we would square these instead of taking the absolute value is not immediately obvious, but it at least makes sense why we would care about the difference between the true and predicted values. What intuition is there for $SSReg?$ Why should we care about the distance between the predicted values and the average value? Further, what does this have to do with an "explained" sum of squares? What is being explained? I can wrap my head around this when $Other = 0$ , such as in OLS linear regressi…
I read this interesting e-print paper on conformal predictors: A Gentle Introduction to Conformal Prediction and Distribution-Free Uncertainty Quantification Conformal predictors are a way to choose a set that's guaranteed to include the true labels with some pre-chosen certainty. I was wondering if there's a way to get conformal predictors to output calibrated probabilities? For example, let's say I have a binary classification (dog or cat images). Conformal predictors can be used to predict whether an image is a dog or a cat in difficult examples. But what I'm looking for is something like calibrated p-values for the prediction. The sigmoid output values (from my neural net, for example) are well known not to reflect actual p-values. Can conformal predictors do this (assuming, of course, I have a calibration dataset available)? If so, can anyone point me to the procedure for this? I can't find it.
I have an example, where I want to automate matching up records in two datasets. I'm wondering what kind of machine learning model would potentially be able to deal with this kind of issue. I'm thinking Maybe some kind of transformer neural network without positional encoding (there's not really an obvious ordering, so LSTM or transformer with positional encoding seem less obvious). The number of records per genre in the real data is low enough that sequence length ought to be okay. Additionally, using pre-trained encoder for language may seem really obvious for capturing embeddings for the text fields, to capture information models have seen during training of role/film/actor name. While the text information will in fact often manage to directly produce the match, working with text only may often not be enough, because we also need to use the date information that may often matter (esp. when things are ambigious/incomplete). Possibly multiple binary losses? Many other models (e.g. GBDTs etc.) cannot deal with the multiple-inputs-multiple-outputs format (while they could of course take in text embeddings). Below are examples of what the data might look like (I cannot share the real data, but the below shares the core features): Genre show_movie year_start year_end Science Fiction Star Trek (original series) 1966 1969 Science Fiction Star Trek: The Motion Picture 1979 1979 Science Fiction Star Trek (2009) 2009 2009 Science Fiction Star Trek: Strange New Worlds 2022 Superhero…
I am trying to extract only the important neurons from the latent space of an Autoencoder to be converted later to a pattern for a model pattern recognizer. PCA Loadings helps in finding the highest correlation coefficient on the neurons of the latent space. Thus, the output of the PCA is not used, only the eigenvalues and eigenvectors to extract which neurons correlate more to the highest eigenvalues and pick only those neurons. For Example, Cifar-10 dataset. Extracting the latent Space of the Autoencoder. Then do PCA and extract the loadings. Pick only the neurons with high correlation to the principal components, with explained variance above 90%. My Questions: Before doing PCA on the latent space, do/do not normalize the data? Is this approach of employing PCA wrong to start with? There are multiple PCA variations like SparsePCA, KernelPCA, and RobustPCA. Is one of variation might be more beneficial for this task?
Cross posted from Mathoverflow Let $X$ and $Y$ be two random variables such that $X\sim Exp(\lambda)$ and $Y$ have positive support and (strictly) increasing hazard rate $h_Y$ . $X$ and $Y$ are independent. Let $Z=X+Y$ . We observe $Z$ and want to infer the hazard rate of $X$ conditional on $Z$ ; $h_{X|Z}$ . The interpretation is that some Poisson event occurs, then we observe ``it occurred" after a stochastic delay $Y$ , and we want to estimate when it occurred based on this observation. My conjecture is that the hazard rate $h_{X|Z}$ is decreasing. I have some elements, but I was not able to complete the proof. Here I go: By definition we have $h_{X|Z}(X=t_0|Z=t)=\frac{P(X=t_0|Z=t)}{P(X\geq t_0|Z=t)}.$ Let's compute the numerator and denominator: $$P(X=t_0|Z=t)=\frac{P(Z=t|X=t_0)P(X=t_0)}{P(Z=t)}=\frac{P(Y=t-t_0)P(X=t_0)}{P(Z=t)}$$ and, $$P(X\geq t_0|Z=t)=\frac{P(Z=t|X\geq t_0)P(X\geq t_0)}{P(Z=t)}.$$ Now observe that conditional $X\geq t_0$ , if $Z=X+Y=t$ , then it must be that $Y\geq t-t_0$ . [THIS WRONG, SEE BELLOW] So $P(Z=t|X\geq t_0)=P(Z=t \cap Y\geq t-t_0|X\geq t_0)$ . And therefore, we have: $$P(X\geq t_0|Z=t)=\frac{P(Z=t|X\geq t_0 \cap Y\geq t-t_0)P(X\geq t_0)P(Y\geq t-t_0)}{P(Z=t)}.$$ So putting numerator and denominator together we have: $$h_{X|Z}(X=t_0|Z=t)=\frac{h_Y(t-t_0) h_X(t_0)}{P(Z=t|X\geq t_0 \cap Y\geq t-t_0)}=\frac{h_Y(t-t_0) \lambda}{P(Z=t|X\geq t_0 \cap Y\geq t-t_0)}$$ . The nominator is decreasing in $t_0$ (because $h_Y$ is increasing). To finish th…
I would like to train a diffusion model with an additional loss on the created image. Without getting into too much details my intention is to do something like regularization, for example you may think that I want to make sure the created image is smooth, or something of the sort. My thinking was to add an additional loss during training, if the vanilla training process is: $$L = ||\epsilon-\epsilon_\theta(x_t, t)||$$ where $\epsilon_\theta$ is the model learning to predict the noise $\epsilon$ added to the original image. My suggested loss is: $$L = ||\epsilon-\epsilon_\theta(x_t, t)|| + \lambda * L'(img_\theta)$$ where $L'$ is my additional loss (which may for example induce smoothness or whatever), $img_\theta$ is the image that we get after denoising $x_t$ using the predicted noise. For standart models it is trivial that this makes sense. Due to the iterative nature of diffusion models I'm not sure if specifically for them it makes sense. I wasn't able to find any work that does something like this, would appreciate any help, does my additional loss makes sense to add?
I'm implementing a multilevel logistic regression model in R to predict a binary courtroom decision with 8 categorical and 7 numerical predictors. I believe a multilevel model to be appropriate because each observation (defendant) is nested within judges. There are a few questions I have that I can't seem to find discrete answers to. There are 18 different judges, so the number of level-2 groups is 18. I have read in multiple scholarly sources that 30 or 50 groups are needed for unbiased fixed-effect parameters and Type 1 error rates. McNeish and Stapleton (2016) suggest these three fixes: (a) RPL variance component, (b) Kenward-Roger adjustment, and (c) bootstrapping. Is J=18 acceptable? How can I use R to determine if the small number of groups produces biased estimates? If 18 is too few level-2 groups, how do I address this in the model? What R packages or commands can I use to fix this? The judges themselves are nested within two neighboring counties in the same state in the US. I believe I have four options: (a) I could do two separate models for each county, (b) make the multilevel model have three levels, (c) add COUNTY as a level-1 predictor, or (d) ignore COUNTY altogether. There are 2403 observations in County A (6 judges in County A) and 1137 observations in County B (12 judges in County B). How do I know which option is best? I have background in statistics, but a lot of the more complicated stuff goes over my head. I am quite familiar with R, but I would sincere…
In the original diffusion model paper by Sohl-Dickstein et al., they explain very little about calculating the loss and training and network to learn the diffusion process. They did publish a repository with code here , which gives a few more clues. Now there is one thing I don't particularly understand, and that is that although the KL divergence is taken over $t=2..T$ , in the code, they sample $t=1..T-1$ and say in the comments, # choose a timestep in [1, self.trajectory_length-1]. # note the reverse process is fixed for the very # first timestep, so we skip it. Now if I understand correctly, with the first timestep of the reverse process is just $t=T$ , which is just the isotropic gaussian, but what I don't understand is, why do they sample from $t=1$ instead of $t=2$ like in the KL divergence. Also, if you were indeed to sample from $t=2$ , how do you learn $f_{\mu}(x^1,1),f_{\Sigma}(x^1,1)$ so that you can reverse the last step? I would expect that to come form the entropy $H_q(X^{(1)}|X^{(0)})$ , but from the code we see that they replace that with the entropy of a Gaussian with $\sigma=\sqrt{1 - a_1} = \sqrt{b_1}$ , $$ H_q(X^{(1)}|X^{(0)}) = \frac{1}{2}(\log 2 \pi + 1) + \frac{1}{2}\log b_1 $$ In the reverse process, you also see that they don't handle the last step of the reverse process any differently. Summarising, how can they sample $t \in 1..T-1$ , and calculate the KL divergence, while the equation specifies that $t \in 2..T$ ? EDIT : After analysing the code…
Building agents with LLM (large language model) as its core controller is a cool concept. Several proof-of-concepts demos, such as AutoGPT , GPT-Engineer and BabyAGI , serve as inspiring examples. The potentiality of LLM extends beyond generating well-written copies, stories, essays and programs; it can be framed as a powerful general problem solver. Agent System Overview In a LLM-powered autonomous agent system, LLM functions as the agent’s brain, complemented by several key components: Planning Subgoal and decomposition: The agent breaks down large tasks into smaller, manageable subgoals, enabling efficient handling of complex tasks. Reflection and refinement: The agent can do self-criticism and self-reflection over past actions, learn from mistakes and refine them for future steps, thereby improving the quality of final results. Memory Short-term memory: I would consider all the in-context learning (See Prompt Engineering ) as utilizing short-term memory of the model to learn. Long-term memory: This provides the agent with the capability to retain and recall (infinite) information over extended periods, often by leveraging an external vector store and fast retrieval. Tool use The agent learns to call external APIs for extra information that is missing from the model weights (often hard to change after pre-training), including current information, code execution capability, access to proprietary information sources and more. Overview of a LLM-powered autonomous agent syste…
You can take the mean of any number of values, including just one value - in that case, the mean will just be equal to that value. Standardized means (standardized first moments) are always equal to zero. You can't calculate variance (the second standardized moment) for only one value, though - you need a minimum of two values to calculate this moment. Since the variance of one number is zero, the standardized variance would be undefined since you'd have to divide by zero in that calculation. I'm wondering if this pattern holds for higher-order moments . In other words, would it not make sense to calculate kurtosis (the 4 th moment) for three values? I know it's possible to calculate kurtosis for three values, but I'm not sold that doing so will actually tell you anything useful; also, this could be a degrees-of-freedom thing - perhaps there just aren't the degrees of freedom to calculate kurtosis for three values. Is it reasonable to claim that, to calculate the n th moment, you need a minimum of n values? Furthermore, it's interesting that skewness is always 0 for groups of 2 observations (it's obvious why) and kurtosis is always 2 for groups of 3 observations (it's not obvious to me why). Higher-order n th moments do not follow this pattern of always being the same when you have n - 1 observations, and here's some R code to prove it. # Calculating Standardized Second Moments (Variances) for Different # Groups of One Observation One_Observation_Groups
I was hoping someone could help with a problem in my area of Optometry. We use visual fields/perimetry to assess patients visual function. This consists of patient responses (or not) to points of light projected onto various locations on the retina at various stimulus intensities. The dimmest light seen is recorded as the threshold sensitivity at that point. Usually 40-60 separate points are tested across each patients retina and then the overall mean sensitivity is given as the average of all individual point sensitivities. My question is this: since the mean sensitivity consists of 40-60 individually tested points, should p-values associated with changes in the mean sensitivity value over time be adjusted? Currently, no correction is applied in our profession as a whole and I'm now wondering if this is incorrect. If a retinal treatment is applied then several point sensitivities will increase (in a non-independent way) contributing to the overall mean sensitivity increasing, however, should the p-value of significant gain in mean sensitivity be adjusted by a factor of 40-60? This is analagous to questions around p-value adjustment in a repeated measures design, except this isn't exactly repeated measures but separate points that are highly dependent on each other. Thank you for any thoughts on this
What is the relation between any suitable measure of model complexity, number of training examples and network size in deep learning?
For given units of a measure of model complexity, how many examples do we need to train a network to get the model right and generalize?
The winners of the 2022 ACM-AAAI Allen Newell Award were celebrated in person during the 2023 ACM awards ceremony, in San Francisco at the The Palace hotel on Saturday, June 10th, 2023. The post 2022 ACM-AAAI Allen Newell Award appeared first on AAAI .
Could you, please, help me with the following problem? Suppose we have a one-way ANOVA with a single 2-level factor. The dependent variable is a logarithmized value: $y_i = log(Y_i)$ . $y_{iz} = \mu + a_i + \epsilon_{iz}$ $z$ is the number of observations in each $i$ group, different for different $i$ . We want to estimate the contrast: $C = a_1 - a_2$ If we exponentiate this contrast we get a ratio of geometric means of the dependent variable in the two treatment groups on the original scale. $C = \frac{\sum_{h=1}^{z} log(Y_{1h})}{z} - \frac{\sum_{h=1}^{z} log(Y_{2h})}{z}$ $C = log(\prod_{h=1}^{z} Y_{1h}^{\frac{1}{z}})- log(\prod_{h=1}^{z} Y_{2h}^{\frac{1}{z}})$ $C = log(\frac{(\prod_{h=1}^{z} Y_{1h})^{\frac{1}{z}}}{(\prod_{h=1}^{z} Y_{2h})^{\frac{1}{z}}})$ Now, suppose we add additional factors in the model. Importantly, we do not add interaction terms in the model. What do we get if we exponentiate the same contrast from the model with additional variables? Do we still get an adjusted ratio of geometric means of some sort? Have you seen any literature on this? I would appreciate any insights!