AI/ML News & Innovations Hub

AI/ML news, top picks, and generated innovation digests.

★ Visit ai-karthik.com
422Sources
40179News Items
8Top Picks
238Blogs
successLast Run

Latest AI/ML News

40179 matching items

fAIr LAC 2024-01-31 13:04 UTC Score 22.0 USR-0219-20240131-ai-specialis-ce68c54a Full article

Energizados

Energizados @administrador Mié, 31/01/2024 - 13:04 Para una sociedad que depende altamente de la disponibilidad, eficiencia y confiabilidad de la electricidad, se hace indispensable para las empresas eléctricas del sector tener una buena administración de la producción y distribución de energía. Uno de los grandes problemas que preocupa son las pérdidas eléctricas. En el transporte de energía, las pérdidas eléctricas son la diferencia entre la electricidad que ingresa a la red y la que es entregada para el consumo final, y son reflejo del nivel de eficiencia de la infraestructura en transmisión y distribución. El concepto de pérdidas eléctricas incluye también la electricidad entregada pero no facturada, que se traduce directamente en pérdidas financieras y sirve como indicador del desempeño operacional de las empresas eléctricas. Problema que se busca resolve El problema que se busca resolver a partir de las pérdidas eléctricas en la red de distribución de energía es la ineficiencia en la entrega y uso de la electricidad. Estas pérdidas pueden deberse al robo de energía, y resultan en la disipación de energía valiosa y en costos adicionales para las empresas de servicios públicos y los consumidores. La reducción de las pérdidas eléctricas no solo contribuye a un suministro más confiable y económico de energía, sino que también tiene un impacto positivo en la sostenibilidad ambiental al reducir la necesidad de generar energía adicional para compensar estas pérdidas. Poblacio…


fAIr LAC 2024-01-31 12:46 UTC Score 22.0 USR-0219-20240131-ai-specialis-72702002 Full article

ViaSegura

ViaSegura @administrador Mié, 31/01/2024 - 12:46 Uno de los mecanismos para salvar vidas en siniestros viales es la detección temprana de las fallas en la infraestructura vial que potencialmente pueden ocasionar las catástrofes. Problema que se busca resolve Actualmente, 1.35 millones de personas mueren y 50 millones son heridas en siniestros de tránsito por año en el mundo. Reducir la siniestralidad en las vías e incrementar la seguridad es posible. Los traumatismos causados por el tráfico vehicular son la principal causa de muerte a nivel global de niños y adultos jóvenes entre 5 y 29 años. Las muertes por accidentes de tránsito son una crisis de salud pública que puede evitarse y que afecta particularmente a los países de ingresos medio y bajo.Las lesiones graves o fatales derivadas de incidentes de tráfico son resultado del diseño y mantenimiento de la infraestructura vial. La seguridad en las carreteras es un enfoque clave del Plan Global para la Segunda Década de Acción para la Seguridad Vial 2021-2030 , que insta a los gobiernos y socios a implementar el Enfoque de Sistemas Seguros para reducir a la mitad las muertes y lesiones viales para el año 2030. Poblaciones que se ven afectadas por el problema Peatones, conductores y pasajeros de vehículos, entidades de logística, concesionarios, y autoridades viales. Respuesta actual a este problema, considerando a las instituciones relacionadas. El análisis de la seguridad vial de las carreteras se por parte de personal espec…

fAIr LAC 2024-01-31 12:40 UTC Score 22.0 USR-0219-20240131-ai-specialis-2961469b Full article

Pavimenta2

Pavimenta2 @administrador Mié, 31/01/2024 - 12:40 Pavimenta2 permite la detección de defectos en el pavimento de autopistas y carreteras, así como la categorización de señales de tráfico verticales y horizontales. La herramienta automatiza el análisis de las condiciones del pavimento utilizando inteligencia artificial (IA) y visión por computadora a partir de videos capturados por una cámara estándar montada en un vehículo. Esto permite a las autoridades de transporte evaluar eficazmente el inventario de carreteras, cruzar datos de accidentes y tiempos de viaje, y estimar los costos de mantenimiento con recursos limitados. La herramienta acorta un proceso que podría llevar varios años a unas pocas semanas de recopilación de videos y horas de procesamiento de imágenes. Problema que se busca resolve Los defectos en el pavimento representan más que una simple incomodidad; constituyen un riesgo significativo para los conductores, dando lugar a colisiones y fatalidades. Históricamente, la identificación de los defectos en las carreteras ha sido un proceso manual, caracterizado por su naturaleza que consume mucho tiempo y sus costos elevados. Analizar manualmente una red de carreteras de 10,000 km demanda aproximadamente 78 semanas y un presupuesto que supera los $3,000,000. Ante semejantes complejidades, los países de América Latina y el Caribe han estado realizando análisis parciales y poco frecuentes de sus redes viales. Poblaciones que se ven afectadas por el problema Autorida…

Relating population-level AUC (Somers's $D_{xy}$) to a mean shift
Cross Validated 2024-01-26 17:43 UTC Score 9.0 AI-113-20240126-social-media-dab1c154 Full article

Relating population-level AUC (Somers's $D_{xy}$) to a mean shift

Say we have group $0$ distributed as $N(\mu, \sigma^2)$ and group $1$ distributed as $N(\mu+\delta, \sigma^2)$ . We then use the Gaussian-distributed variables to predict group membership. It seems like we should have some way to relate $\delta\big/\sigma^2$ to the area under the receiver-operator characteristic curve, and a simulation supports this idea. library(pROC) library(ggplot2) set.seed(2024) N Mathematically, what is this relationship, and how specific is it to Gaussians?

fAIr LAC 2024-01-25 13:04 UTC Score 25.0 USR-0219-20240125-ai-specialis-b4045179 Full article

Alerta de sepsis hospitalaria Laura

Alerta de sepsis hospitalaria Laura @administrador Jue, 25/01/2024 - 13:04 Se esta implementando una solución de inteligencia oficial en el Hospital Villa El Salvador para la identificación de sepsis utilizando algoritmos desarrollados por la empresa Laura. Problema que se busca resolve Detección temprana de sepsis hospitalaria Poblaciones que se ven afectadas por el problema Población internada en el hospital Villa El Salvador de Lima. Propuesta para solucionar dicho problema usando IA Detección temprana de sepsis con base en información de historia clínica electrónica. Avances/resultados Se está llevando acabo la implementación. Metas Finalización del piloto e inicio de análisis de datos. Principales retos en la implementación Participación del equipo del hospital dado el limitado numero de personal con el que cuentan. Principales retos de la IA identificados Acceso a información debidamente estructurada. Sector Salud País Perú Contacto fairlac@iadb.org Entidad Ejecutora MINSA Estado Uso y monitoreo

fAIr LAC 2024-01-25 13:00 UTC Score 22.0 USR-0219-20240125-ai-specialis-0b339bea Full article

Protección trayectorias educativas

Protección trayectorias educativas @administrador Jue, 25/01/2024 - 13:00 El sistema educativo uruguayo presenta importantes desafíos para lograr trayectorias continuas, completas y exitosas de los jóvenes. A pesar de haber alcanzado la cobertura universal en primaria, un importante porcentaje de estudiantes uruguayos repite los primeros grados (13,4% en 1º grado y 6,9% en segundo grado). Estas altas tasas de repitencia generan rezago, y al llegar al 6º grado el 29% de los alumnos tienen sobreedad. Estos problemas en la educación primaria tienen impacto en la educación media (EM), donde Uruguay enfrenta tres retos: (i) la integración, retención y egreso de los jóvenes en el sistema; (ii) la calidad en términos de aprendizajes y desarrollo de competencias: y (iii) la equidad. Respecto al primer reto, aun cuando la EM es obligatoria la asistencia escolar disminuye a partir del ingreso a este nivel. En 2013 la tasa neta de matrícula (TNM) en la educación media básica (EMB) fue de 76,2%. A la dificultad que presenta el sistema para incorporar a los jóvenes se le suma el hecho de que el 25% de los estudiantes uruguayos de EMB tienen dos o más años de rezago escolar. Como resultado, la tasa de egreso de la EMB es solo del 57%. Todos los indicadores de la EMB ponen a Uruguay en comparación desfavorable respecto de países como Chile (88%) y Ecuador (73%). La situación se agrava en la educación media superior (EMS), donde se evidencian las dificultades del sistema para retener a los…

fAIr LAC 2024-01-25 12:55 UTC Score 27.0 USR-0219-20240125-ai-specialis-64cb8620 Full article

Predicción de Abandono y Reprobación Escolar

Predicción de Abandono y Reprobación Escolar @administrador Jue, 25/01/2024 - 12:55 El proyecto de construcción de algoritmos predictivos de deserción y fracaso escolar tiene como objetivo la modelación de algoritmos que predicen el riesgo de deserción y reprobación escolar para el nivel de secundaria. Problema que se busca resolve Reducir abandono escolar y tasas de repitencia. Poblaciones que se ven afectadas por el problema Estudiantes de 10-12 año (ensino medio) de Redes Estaduales Públicas Respuesta actual a este problema, considerando a las instituciones relacionadas. Acciones inorgánicas con escaso respaldo en información actualizada, para docentes, directores y niveles regionales de gestión. Propuesta para solucionar dicho problema usando IA Elaborar un sistema de alerta temprano para detectar abandono y reprobación – piloto con escuelas de secundaria de la Secretaria Estadual de Educação do Espírito Santo (Brasil), con apoyo del Instituto Unibanco. ¿Qué consideraciones de seguridad, leyes nacionales o estándares se tienen que tener en cuenta para utilizar cada fuente de información? Ley de protección de datos personales. Avances/resultados Convenios de uso de datos firmados: inicio de las tareas técnicas de desarrollo de algoritmos de predicción. Metas Concluir algoritmos de predicción. Elección de próxima red educativa. Principales retos en la implementación Definición de protocolos de intervención pedagógicos a partir de los riesgos identificados. Gobernanza. Prin…

fAIr LAC 2024-01-25 12:45 UTC Score 27.0 USR-0219-20240125-ai-specialis-699149c2 Full article

Asignación centralizada de alumnos (Perú)

Asignación centralizada de alumnos (Perú) @administrador Jue, 25/01/2024 - 12:45 Alertas de riesgo 3 años. Se usa ML para predecir riesgo Problema que se busca resolve El problema descrito es que los usuarios interactúan con plataformas centralizadas de búsqueda y elección, como los sistemas de selección de escuelas, con información limitada y creencias sesgadas. Esto conduce a ineficiencias y, en ocasiones, a desigualdades en las asignaciones finales. También hay evidencia de que buscar opciones como escuelas es costoso y que los solicitantes enumeran demasiadas pocas opciones debido a creencias sesgadas sobre las probabilidades de asignación. Poblaciones que se ven afectadas por el problema Los estudiantes de Tacna que ingresan al sistema educativo entre pre-K y grado 1 (3-6 años) Respuesta actual a este problema, considerando a las instituciones relacionadas. El artículo propone colaborar con los Ministerios de Educación para enviar "boletines informativos" a los solicitantes durante la fase piloto de plataformas centralizadas de elección de escuelas. Estos boletines, dados a un grupo seleccionado al azar, proporcionan información sobre las opciones de escuelas disponibles para mejorar la toma de decisiones y las asignaciones. Propuesta para solucionar dicho problema usando IA El envío de estas tarjetas permite que los usuarios cuenten con más información en el momento de la elección de plataforma digital Avances/resultados Los estudiantes agregan más y mejores escuelas e…

fAIr LAC 2024-01-25 12:22 UTC Score 24.0 USR-0219-20240125-ai-specialis-f2d42583 Full article

Asignación centralizada de docentes (Ecuador)

Asignación centralizada de docentes (Ecuador) @administrador Jue, 25/01/2024 - 12:22 Quiero ser maestro Problema que se busca resolve El proyecto busca resolver las ineficiencias en el mercado laboral de docentes, causadas por una falta de información. Examina cómo las preferencias de los profesores por escuelas más cercanas a su hogar, ubicadas en áreas urbanas, con mejor infraestructura o con estudiantes de mayor ventaja socioeconómica, resultan en una alta demanda para algunas escuelas y vacantes en otras. Poblaciones que se ven afectadas por el problema Los maestros que participan del concurso Quiero Ser Maestro en Ecuador Respuesta actual a este problema, considerando a las instituciones relacionadas. El estudio pone a prueba una intervención con el fin de mejorar la asignación de empleos y la tasa de plazas ocupadas, proporcionando información más precisa a los docentes. Propuesta para solucionar dicho problema usando IA Específicamente, para informar mejor a los candidatos a docentes que participaron en el proceso de selección de Ecuador en 2021, estos últimos recibieron un informe personalizado a través de WhatsApp y correo electrónico que contenía un resumen de su solicitud. Para los candidatos cuyo riesgo estimado de no ser asignados era "alto" (por encima de un nivel de corte definido), el informe también incluía una advertencia de riesgo de no asignación y una lista de escuelas recomendadas donde tenían mayores posibilidades de asegurar una posición. Evaluamos el…

Disrupt Africa 2024-01-23 06:00 UTC Score 22.0 USR-0197-20240123-regional-new-8104099a Full article

How Egyptian prop-tech startup Partment enables hassle-free 2nd home ownership

Egyptian prop-tech startup Partment is working to redefine second-home ownership and real estate investment via its “invest and experience” co-ownership platform. Founded in 2022, Partment offers users the chance to part-invest in meticulously curated properties, enabling personalised and diversified real estate portfolios. Through fractional ownership, co-owners access a set number of nights for personal use [...]

Disrupt Africa 2024-01-23 04:00 UTC Score 15.0 USR-0197-20240123-regional-new-1a1f42c5 Full article

Announcing the $5M Core Africa Innovation Fund: Empowering Local Web3 Builders

Core DAO is excited to introduce the African Innovation Fund, a groundbreaking initiative to provide resources and networks to support local Web3 builders and projects across the African continent. This new fund is set to foster innovation, sustainability, accessibility and growth within the African blockchain ecosystem. If you’re building interesting web3 projects in Africa and [...]

Disrupt Africa 2024-01-22 09:00 UTC Score 25.0 USR-0197-20240122-regional-new-f1786302 Full article

UNDP launches “timbuktoo” financing initiative for African startups

The United Nations Development Programme (UNDP) has launched the “timbuktoo” initiative together with African countries, which it said is positioned to be “the world’s largest financing facility”, bringing catalytic and commercial capital together to support Africa’s startup ecosystem. President Paul Kagame of Rwanda, President Nana Akufo-Addo of Ghana, African Continental Free Trade Area secretariat secretary [...]

Disrupt Africa 2024-01-22 07:00 UTC Score 20.0 USR-0197-20240122-regional-new-9e41eedd Full article

10 startups selected for Africa Tech Summit Nairobi Investment Showcase

Africa Tech Summit Nairobi has announced the 10 African tech ventures that will showcase their solutions to an audience of industry experts, investors and fellow innovators on February 14-15. Africa Tech Summit Nairobi is a leading African tech event providing insight and networking with the African tech ecosystem, bringing together tech leaders, MNOs, banks, international [...]

Disrupt Africa 2024-01-22 06:00 UTC Score 35.0 USR-0197-20240122-regional-new-b9540028 Full article

Egyptian e-health startup Yodawy banks $10m funding

Egyptian digital healthcare startup Yodawy, which has pioneered a pharmacy benefit management platform in the MENA region using technology, expert pharmacists, and state-of-the-art logistics, has raised US$10 million in extra funding, taking its total raised capital to US$34.5 million. Founded in 2018, Yodawy enables its partners – insurance companies, medical providers, pharmacies, and pharmaceutical/FMCG companies [...]

Cross Validated 2024-01-20 17:28 UTC Score 9.0 AI-113-20240120-social-media-3fd66bf8

If $A^2$, and $B^2$ are DEPENDENT random variables, will $A$, and $B$ be necessarily DEPENDENT too?

I know that if $A$ , and $B$ are independent, the independence is preserved for $A^c$ , and $B^c$ , where $c$ is a constant. I am wondering if the same applies to the case where the random variables are dependent. I have been trying to check the relationship between two random variables $A$ , and $B$ . Using MATLAB and generating millions of samples, I get $\text{cov}(A,B) = 0$ , which tells me that $A$ , and $B$ could be either "independent" or "dependent with non-linear relation". Then I decided to find $\text{cov}(A^2,B^2)$ , and it is not 0. I know that if $\text{cov}(A^2,B^2) \ne 0$ , then, $A^2$ , and $B^2$ are dependent, and I am guessing that the dependency is preserved for $\sqrt{A^2}$ , and $\sqrt{B^2}$ . Is my guess correct? I suppose taking the square root could not make them independent. If my guess is correct, would the interpretation that the square root function is transforming a linear dependency into a non-linear dependency be correct too? The rationale would be that $\text{cov}(A^2,B^2) \ne 0$ , induces a linear dependency, and $\text{cov}(A,B) = 0$ , induces a non-linear dependency.

Power analysis for a quasi-experimental factorial design 3(manipulated) x 1 (measured) ANCOVA
Cross Validated 2024-01-20 11:49 UTC Score 12.0 AI-113-20240120-social-media-231c8546 Full article

Power analysis for a quasi-experimental factorial design 3(manipulated) x 1 (measured) ANCOVA

I'm experiencing an hard time looking for the proper analysis to use to compute the power for an experiment i'd like to implement, so here is my question for you. I'd like to run a quasi-experimental design A (manipulated: 3 levels) X B (measured: ordinal with 5 levels but treated as continuous) and controlling for 2 continuous confounding variables. The instruments I'm using are quite reliable (alpha's are .84, .94, .99). My first choice would be simply running on G*Power a power analysis for a multiple regression with 3 tested predictors (IV,IV and interaction term) and 5 predictors in total (IV,IV,interaction term and 2 confounders), with a small predicted interaction effect. But I know that there are many things wrong here. I think that treating and ordinal IV as continuous is the worst, cause therein lies the problem: if I had 5 levels I would need 1829 subjects (Ancova, fixed effects, main effects and interactions: EF f=.10, alpha = .05, Power = .80, df = 14, groups = 15, covariates = 2). Then I think about the second option. Theory on the measured IV states that answers from 4 and above are to be treated as 'high' so, i think, I could split subjects on this premise. But then i could lose information and/or power, and, moreover, I would anyway need more than 1200 subjects. Then, i think moreover (third possibility), I could just feed parameters into a hierarchical regression and see what sample size I get but the manipulated variable obviously doesn't allow me to use t…

Disrupt Africa 2024-01-20 06:00 UTC Score 22.0 USR-0197-20240120-regional-new-192701b2 Full article

Third episode of new Disrupt Podcast series shines light on Africa’s ed-tech space

Disrupt Africa has released the third – and last – episode of its three-part podcast series zeroing in on the state of Africa’s ed-tech space, looking at trends, opportunities and challenges within the vital sector. Disrupt Podcast has released a number of focused series in the last couple of years, including ones on venture capital, [...]

Disrupt Africa 2024-01-19 22:14 UTC Score 15.0 USR-0197-20240119-regional-new-8a76ba44 Full article

Which Meme Coins to Buy in 2024? Top Meme Coins by Market Capitalization and New Trending Coins Including ApeMax, Dogecoin, Shiba Inu, Pepe Coin, Floki, Memecoin by 9gag, and Bonk

The meme coin landscape is experiencing a resurgence, with established players like Dogecoin and Shiba Inu maintaining their dominance in the market while new coins like Pepe and Dogwifhat experience recent price surges. These new coins, alongside the “Boost-to-Earn coin ApeMax, are quickly gaining traction because of their innovative features. Based on information gathered from [...]

Disrupt Africa 2024-01-19 22:02 UTC Score 12.0 USR-0197-20240119-regional-new-193a13b7 Full article

5 Top Trending Altcoins to Buy Now | Can These Altcoins Explode After The Bitcoin Halving? (ApeMax, Arbitrum, Polkadot, Skale, Maverick Protocol)

The crypto market is buzzing with anticipation as some analysts predict a potential bull run in 2024 with key events like the upcoming Bitcoin halving event predicted to take place in April 2024. Amidst this excitement, many crypto enthusiasts, traders, and analysts are actively seeking the next big altcoin, extending their interests beyond the more [...]

Disrupt Africa 2024-01-19 21:52 UTC Score 20.0 USR-0197-20240119-regional-new-d26021d4 Full article

Should Investors Get Excited About XRP’s $1.8 Billion Trading Volume? Why Crypto Whales are Turning to Launchpad Instead – The Best Passive Income Crypto in 2024

”Should you invest in an established crypto that shows high promise of winning its lawsuit? Or a new and relatively unknown altcoin quickly gaining traction for its presale that’s now live?” While Bitcoin has dipped by 2.80% in the past week, XRP has achieved a steady growth rate of 2.5% within the same timeframe. It’s [...]

Disrupt Africa 2024-01-19 21:43 UTC Score 12.0 USR-0197-20240119-regional-new-6e7e1da6 Full article

​​5 Meme Coins on Investor’s Watch Lists for Upcoming Alt Coin Season 2024

Finding the next meme coin with the potential for a 100x return on investment can be a daunting task in the current crypto landscape. The market is saturated with numerous meme coins, making it challenging to identify promising projects that stand out. However, there are strategies to improve your odds of success, such approaches many [...]

Dimension Mismatch in Transformer Decoder: What Are the Input and Output Dimensions?
Cross Validated 2024-01-17 11:23 UTC Score 15.0 AI-113-20240117-social-media-b6b02d4e Full article

Dimension Mismatch in Transformer Decoder: What Are the Input and Output Dimensions?

My understanding is that in the decoder, the output of the masked self-attention mechanism is expected to have dimensions (o_len,d_model), where o_len is the current output length. However, an issue arises when the keys (K) and values (V) used in the self-attention of the decoder are obtained from the output of the encoder. Their dimensions are (n, d_model), where n represents the number of embedding vectors. This poses a problem during the computation of Q x K^T because Q has size (o_len,dq), while K^T has a size of(d_model,n), and dq is not equal to dmodel. ​

Chip Huyen Blog 2024-01-16 00:00 UTC Score 44.0 USR-0111-20240116-ai-specialis-9651fc41 Full article

Generation configurations: temperature, top-k, top-p, and test time compute

ML models are probabilistic. Imagine that you want to know what’s the best cuisine in the world. If you ask someone this question twice, a minute apart, their answers both times should be the same. If you ask a model the same question twice, its answer can change. If the model thinks that Vietnamese cuisine has a 70% chance of being the best cuisine and Italian cuisine has a 30% chance, it’ll answer “Vietnamese” 70% of the time, and “Italian” 30%. This probabilistic nature makes AI great for creative tasks. What is creativity but the ability to explore beyond the common possibilities, to think outside the box? However, this probabilistic nature also causes inconsistency and hallucinations. It’s fatal for tasks that depend on factuality. Recently, I went over 3 months’ worth of customer support requests of an AI startup I advise and found that ⅕ of the questions are because users don’t understand or don’t know how to work with this probabilistic nature. To understand why AI’s responses are probabilistic, we need to understand how models generate responses, a process known as sampling (or decoding). This post consists of 3 parts. Sampling : sampling strategies and sampling variables including temperature, top-k, and top-p. Test time compute : increasing the compute allocated to inference, e.g. sampling multiple outputs, to help improve a model’s performance. Structured outputs : how to get models to generate outputs in a certain format. Sampling Given an input, a neural networ…

Block size in subsampling and bootstrap for time series
Cross Validated 2024-01-14 20:13 UTC Score 12.0 AI-113-20240114-social-media-782c03c3 Full article

Block size in subsampling and bootstrap for time series

I have a dependent variable, a time series of 80 periods (discrete decisions). I am doing maximum likelihood estimation with 10 parameters. Now I want to get the standard error or confidence interval of the estimates of these 10 parameters. One feature of my likelihood function is that the decisions is determined by all the history of $x$ , and the weight of past $x$ decreases geometrically: $x_t+\rho x_{t-1}+\rho^2 x_{t-2}$ ... where $\rho$ is one of the parameters needed to be estimated. So I am thinking that moving block bootstrapping perhaps is not suitable to sustain the data structure, and I should use subsampling. But subsampling of a given block size leaves me a very few subsamples. For example, if I choose a block size of 40, I get only 41 subsamples. Should I concern about it? Is it sufficient? Can I use multiple block sizes to construct a confidence interval? Is there any other alternatives that I could use to get standard error or confidence interval?

Fitting a glmmTMB mode with pre-defined coefficients
Cross Validated 2024-01-13 21:19 UTC Score 21.0 AI-113-20240113-social-media-a6e39316 Full article

Fitting a glmmTMB mode with pre-defined coefficients

I'm working on an analysis in which I conducted multimodel inference and model averaging using glmmTMB, which I used for the ordered beta distribution and I would like to stick with. I dredged the global model, took the 95% confidence set, and calculated the average coefficient for each predictor. Now, however, I would like to figure out how well this averaged model explains the data. Is there a way of making or fitting a model object with predefined coefficients? I would then use this in k-fold cross-validation, and/or in performance::r2, but either way I need a model object. Here is an example: data = data.frame(response = c(0.5, 0.2, 0.3, 0.6, 0.75), varA = c(0, 0.2, 0.4, 1, 0.8), varB = c(-0.4, -1.3, 0.3, 1.6, 0.8), varC = c(-1.2, -0.1, 0.5, 1.2, -0.3)) model Ultimately, I end up with a set of coefficients that are similar to, but different than, my global model. I thought about going into the global model object and manually overwriting the variable coefficients in the object (eg, model$fit$par[1] is the intercept, model$fit$par[2] is varA, and so on.) However, there are other parameters that I don't know how to obtain without refitting the model with the new averaged coefficients, one labelled "betad" and two labelled "psi". Could someone please suggest either a) how to fit the model using varA_coeff, varB_coeff, and varC_coeff, b) how to figure out "betad" and "psi" without refitting the model, or c) an alternative way to evaluate the fit of my averaged model?

Cross Validated 2024-01-12 22:42 UTC Score 12.0 AI-113-20240112-social-media-6e13bf2f

Obtaining confidence intervals from composite defined functions

Assume you have a set of $n$ independent random variables $X_1, X_2, \dots, X_n$ with unknown distribution and mean (finite) values $\mu_1, \mu_2, \dots, \mu_n \in \mathbb{R}$ . Moreover, there are $n$ known probabilities $p_1, p_2, \dots, p_n$ with $p_i > 0$ and $p_1 + p_2 + \dots + p_n = 1$ . Upon it, we construct a random variable $X$ defined as: $$X = \begin{cases} X_1 & \text{with probability }p_1\\ X_2 & \text{with probability }p_2\\ \dots\\ X_n & \text{with probability }p_n \end{cases}$$ So, basically speaking, $X$ (which also has an unknown finite mean $\mu$ ) takes the value from one random variable $X_1, X_2, ..., X_n$ with a certain probability. We can create i.i.d. $k$ samples $x_1, x_2, \dots, x_k$ from $X$ and can calculate a confidence interval for the mean $\mu$ , e.g., by using the Student's $t$ distribution. The question is now the following: Assume that we do not sample directly from $X$ , but take $k_1$ samples from $X_1$ , $k_2$ samples from $X_2$ , and so on. We can calculate for each individual random variable $X_1, X_2, \dots, X_n$ the confidence intervals for the means $\mu_1, \mu_2, \mu_3$ , but can we also compute for $X$ a confidence interval for the mean $\mu$ from these $k_1 + k_2 + \dots + k_n$ samples, as these are not i.i.d. samples for $X$ anymore? Example: We know beforehand that $n = 3$ and $p_1 = 0.2, p_2 = 0.4, p_3 = 0.4$ . Furthermore, we assume that each $X_i$ is Bernoulli distributed with an unknown mean $\mu_i$ , so it is either $0$…

publically available language models that can be used to train arbitrary language data?
AI Stack Exchange 2024-01-12 08:00 UTC Score 21.0 AI-110-20240112-social-media-9bd62ed3 Full article

publically available language models that can be used to train arbitrary language data?

I have sentence data in a language that is not widely in use and as such popular LLMs do not support the language. I want to train some language model such that given some question, it is able to respond back in the same language, just as in ChatGPT just with a different language. In such a case, what language model is publically available and is sufficiently powerful? Or would it be possible to use popular LLMs (such as ChatGPT) to achieve such a goal?

AI Stack Exchange 2024-01-07 09:52 UTC Score 15.0 AI-110-20240107-social-media-f675f662 Full article

How does one annotate overlapping objects in instance segmentation?

As I struggle to find any literature online about this, I wanted to ask about it here so that others could learn. My question is inspired by a Yolo GitHub issue . In this example we have 2 objects, here a plate and an egg, with one object being inside the other one. The question is how to annotate the plate (aka the outer object). Annotate full contour of outer object. Some pixels belong to 2 classes. Make a little bridge to the inner object so that the contour of the outer object excludes the inner object. This question arose while using Yolo but can be extended to other instance segmentation models. Any more information regarding good practices in instance segmentation is more than welcome.

Cross Validated 2024-01-04 10:15 UTC Score 10.0 AI-113-20240104-social-media-b70247ac

Bagging Ensemble Math

You are working on a binary classification problem with 3 input features and have chosen to apply a bagging algorithm (Algorithm X) on this data. You have set max_features = 2 and n_estimators = 3. Each estimator has an accuracy of 70%. Algorithm X aggregates the results of individual estimators based on maximum voting. I get a solution. The maximum accuracy you can get is 79.85% (rounded to two decimal places). Here’s how to calculate it: The probability of a single estimator being wrong is 30%. The probability of all three estimators being wrong is 0.3 * 0.3 * 0.3 = 0.027. Therefore, the probability of at least one estimator being correct is 1 - 0.027 = 0.973. The probability of all three estimators being correct is 0.7 * 0.7 * 0.7 = 0.343. Therefore, the probability of at least two estimators being correct is 3 * 0.7 * 0.7 * 0.3 = 0.441. The probability of all three estimators being correct or at least two estimators being correct is 0.343 + 0.441 = 0.784. Finally, the probability of the majority vote being correct is 0.784 + 0.5 * 0.027 = 0.7985. Therefore, the maximum accuracy you can get is 79.85% (rounded to two decimal places). Is it correct? If yes, then can anyone explain 0.343 + 0.441 = 0.784.

How does autoregressive training help limit compounding errors at inference?
Cross Validated 2023-12-30 02:56 UTC Score 24.0 AI-113-20231230-social-media-f4bec8e3 Full article

How does autoregressive training help limit compounding errors at inference?

I'm having a little trouble justifying something in my head and was hoping someone could provide some intuition? I understand for LSTM models or models that maintain some state about a sequence that training auto regressively makes sense to help a model learn to manage its context and states. What I am struggling with is if we used a model that did not maintain some hidden state. For this example lets say that we have some time series x and we apply an AR model to the series. Now say we replace the parameters of the AR model with multiple fully-connected layers. I believe training the model on one step ahead predictions and applying it to multi step would introduce compounding errors, but I cannot justify this intuitively to myself in my head. Could anyone shed light on this? I keep coming back to the idea that basically one step ahead training here is just like teacher forcing techniques for LSTMS. Any insight is much appreciated!

Given an array of different non integer values, how do I find the value where 99% of the data is above and value where 99% is below
Cross Validated 2023-12-27 19:56 UTC Score 15.0 AI-113-20231227-social-media-6f6f94d2 Full article

Given an array of different non integer values, how do I find the value where 99% of the data is above and value where 99% is below

I can easily find the min and the max of the list by going through the list, But I can't seem to figure out how to get 99% of the min and 99% of the max. I need this mainly because there are some spikes in data and I want to draw it without those spikes I would think taking a weighted average of the entire distribution, then dividing by the weight*99 would give me the 1% location, and weight/99 would give me the 99% location. Is this correct? I am trying to solve the problem without sorting the array

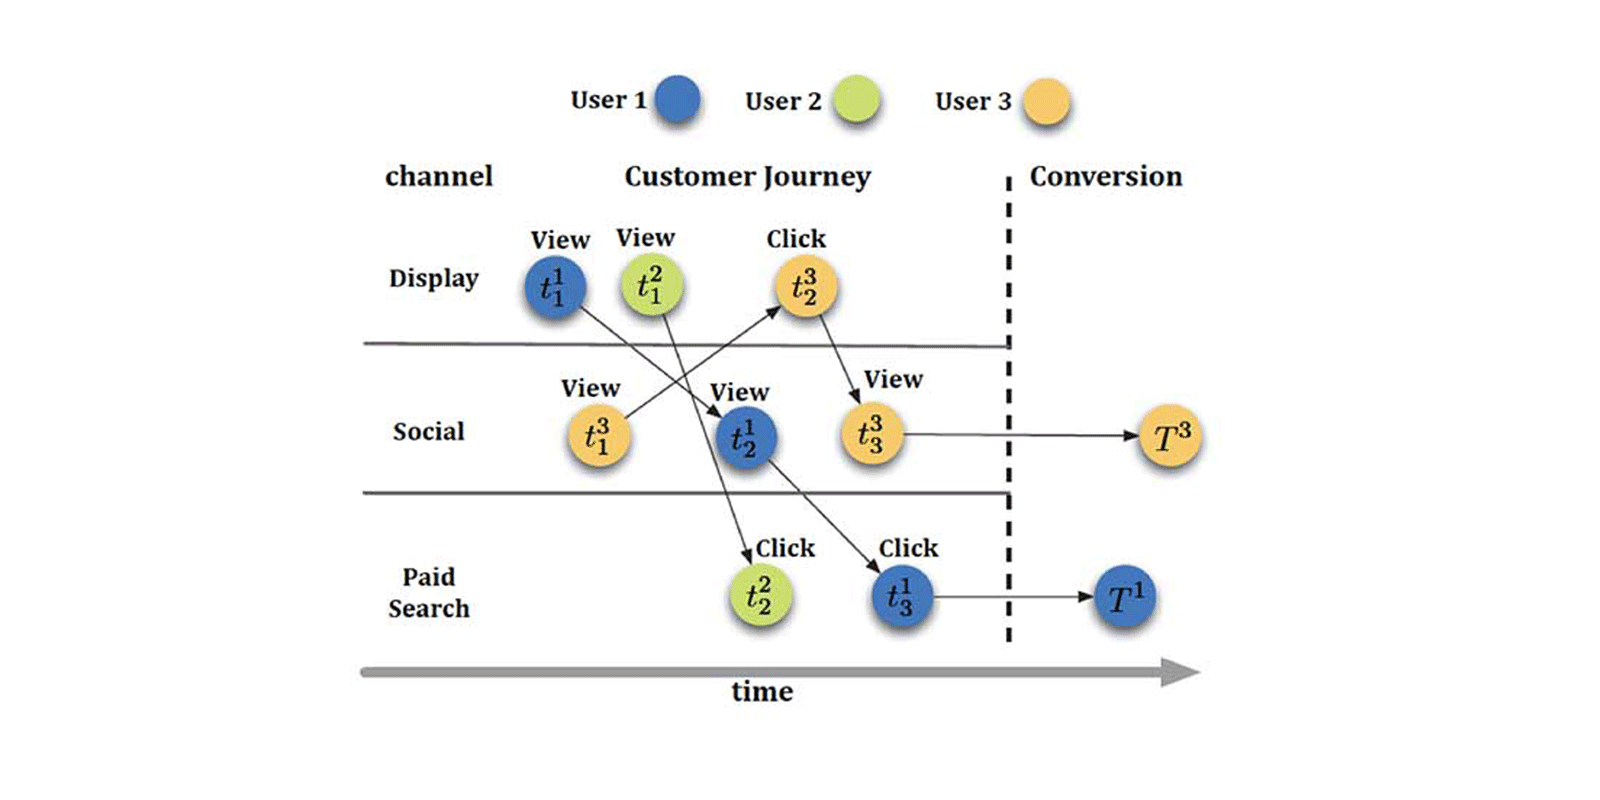
Comment on State-Of-The-Art Approaches to Attribution in Marketing by Bay tech media
TOPBOTS 2023-12-27 18:30 UTC Score 26.0 AI-043-20231227-ai-specialis-074811ae Full article

Comment on State-Of-The-Art Approaches to Attribution in Marketing by Bay tech media

In the realm of digital marketing, attribution methodologies have undergone significant advancements. State-of-the-art approaches include Multi-Touch Attribution (MTA) for holistic channel tracking, Algorithmic Attribution leveraging machine learning for precise credit assignment, Cross-Device Attribution capturing interactions across devices, Incrementality Testing to gauge true marketing impact, and AI-Powered Attribution for deep data analysis. Bay Tech Media implements these cutting-edge methods, empowering businesses with accurate insights to refine and optimize their marketing strategies effectively.

Causal Inference When Treatment and Outcome Are Aggregated At Different Levels
Cross Validated 2023-12-26 16:55 UTC Score 21.0 AI-113-20231226-social-media-f9428b84 Full article

Causal Inference When Treatment and Outcome Are Aggregated At Different Levels

Consider a scenario where a treatment is a U.S. state-level policy (some states adopted the policy while others did not) and the outcome are individual-level responses to a survey across American states. To make this scenario less abstract, let's say that the policy is gun-reform legislation and the outcome is individual perceptions of safety. As a result, treatment and outcome are aggregated at different levels. Immediately, I can see an issue with this approach as it relates to identifying confounders to adjust for. For example, ideology seems like a clear confounder in this case, but ideology aggregated in what way? The ideological make-up of the state will impact the probability of adopting gun-reform legislation and the ideology of an individual will impact their perception of safety, but the ideology of a state and the ideology of an individual are two separate (but related) concepts. Also, if this is the case, is "ideology" even a confounder? Naively, I can say that: Gun Reform $\leftarrow$ Ideology $\rightarrow$ Safety Perception But this isn't really true, is it? Because, what I'm actually assuming are two separate measures of ideology entirely: Gun Reform $\leftarrow$ State's Ideological Makeup Safety Perception $\leftarrow$ Individual's Ideology How might one handle situations such as these, where problems seem to be driven solely by the different level of aggregation between treatment and outcome? One obvious course might be to average the responses of the outcom…

Cross Validated 2023-12-19 19:51 UTC Score 12.0 AI-113-20231219-social-media-e6b7dc4f

How to do dimension reduction from a variational autoencoder

I am thinking about a variational autoencoder. As far as I understand it, in the encoding section you compress to a px1 tensor and then you create a $\mu$ and $\sigma$ of dimensions of my choice (though less than $p$ ). The decoding layer is then the reverse. But what if I want to do dimensionality reduction using the VAE? Clearly I don't randomly sample from $\mu$ and $\sigma$ . Do I just go to the px1 tensor? Thanks!

Canonical correlation analysis - loadings vs coefficients
Cross Validated 2023-12-19 13:35 UTC Score 12.0 AI-113-20231219-social-media-6d9bc241 Full article

Canonical correlation analysis - loadings vs coefficients

I'm trying to wrap my head around how to interpret the results of CCA. I've got a fairly deep understanding of OLS regression, and I've read a lot of helpful CCA explainers like this one by @ttnphns . However, I'm still struggling with one particular aspect of the logic of what one apparently does with the CCA results. I'll unpack below, using terminology from the R package CCA to refer to different elements. In particular, I understand that the math of CCA treats X and Y identically, i.e., this is correlation, not regression. But, in a situation where Y is logically downstream of X, and where Y comprises multiple theoretically independent outcomes, the idea of using the ycoef s, which are essentially regression coefficients specifying the linear combination of y s that produce a given yscore , and which, like OLS regression, reflect the joint influence of the given y and all the other y s , doesn't make sense to me. Again, I understand the math of how a given yscore is derived, and how that is reflected in the ycoef s. What I don't like is the idea of reporting how the various y s 'contributed to' constructing this synthetic latent variable in a regression sense, because in reality, all the y s arose independently—or, more in keeping with the logic of CCA, they were all driven by some set of latent variables. What makes sense to me would be to report the xcoef s alongside the corr.Y.yscores , that is, the coefficients for how each x relates to a given xscore , and the loadi…

Salmon in the Loop
The Gradient 2023-12-16 17:00 UTC Score 10.0 AI-037-20231216-ai-specialis-78cb7372 Full article

Salmon in the Loop

On fish counting – a complex sociotechnical problem in a field that is going through the process of digital transformation.

Fixed-effect model with ridge regression, or how else to deal with multicollinearity
Cross Validated 2023-12-15 01:26 UTC Score 18.0 AI-113-20231215-social-media-83bd6b0b Full article

Fixed-effect model with ridge regression, or how else to deal with multicollinearity

I am currently writing a registered report for data which will be clustered within eight countries. Since that is too few to do a multilevel model with random effects (McNeish & Stapleton, 2016), I've chosen a fixed effects approach, where the country clusters are modelled as fixed effects (dummy variables) and the standard error is is multiplied by the square root of the unconditional design effect (McNeish & Kelley, 2019; McNeish & Stapleton, 2016). I've already set up a Monte Carlo simulation to do a power analysis for such a model. However, one there is one problem. One analysis in my study will be to check for the effect of one variable while controlling for another variable, and there is reason to assume both would be correlated. Some degree of multicollinearity is of course fine, but I'm worried about what to do if it gets too substantial. I cannot drop one of the variables, since they both need to be there for theoretical reasons. In regular multiple regression models, a typical recommendation is ridge regression - but to do my fixed effects model, I would have to obtain p values by first multiplying the standard error with the square root of the unconditional design effect, and standard error estimates in penalised models seem to be an issue, with statistical software often not containing functions to obtain them because they wouldn't be very meaningful anyway. So, I'm a bit stuck on how to proceed here - do I use ridge regression and obtain the standard error estim…

Multiple linear regression with possibly non-independent explanatory variables
Cross Validated 2023-12-13 21:31 UTC Score 9.0 AI-113-20231213-social-media-09fba7d8 Full article

Multiple linear regression with possibly non-independent explanatory variables

For a given household for which I have many years of historical data, I want to predict the home gas consumption (heating) with a few variables among: date gas min_temp max_temp mean_temp relative_humidity absolute_humidity other_column 2023-01-01 5.8 m^3 -3.0°C 2.3°C -1.2°C 79 % 4 g/m^3 ... 2023-01-02 4.8 m^3 2.0°C 4.2°C 2.3°C 82 % 4.5 g/m^3 ... ... I could do a multiple linear regression for $$\rm{gas\ consumption} = \beta_0 + \beta_1 \rm{min\ temp} + \beta_2 \rm{max\ temp} + \beta_3 \rm{mean\ temp} + ... + \varepsilon,$$ but since many of these variables are not independent of each other (and maybe nearly collinear), doing a standard multiple linear regression might give bad results (for example with some negative $\beta_i$ where it shouldn't). Which better solution can we use? PCA + multiple linear regression (PCR) or PLS or something else? Note: I'd like to avoid using all 3 (min, max, mean) temp, if possible. How can we evaluate the loss if using using only 1 temperature variable (the best fit among the 3) instead of the 3 variables?

A new old kind of R&D lab
Fast.ai 2023-12-11 14:00 UTC Score 25.0 AI-185-20231211-developer-an-8e33d8a2 Full article

A new old kind of R&D lab

Answer.AI is a new kind of AI R&D lab which creates practical end-user products based on foundational research breakthroughs.

Data Science Stack Exchange 2023-12-06 16:43 UTC Score 27.0 AI-111-20231206-social-media-afd8a7cd

CNN training accuracy flatlines

I'm training a CNN from scratch to do tagging of images. And my training is going nowhere. I was hoping someone could help me identify an obvious error. I would like to end up with a network that given an image can output 0 or 1 if it contains a face or not. I know there are a lot of pre-trained models that can do this, but this is only a starting point for me. My dataset consists of a CSV that looks like this. I have chose this format, because I plan to add more tags to the dataset in the future. filename,face img1.jpg,0 img2.jpg,1 ... ... which I load into a pandas dataframe with load_csv(). Then I create a training generator. datagen = ImageDataGenerator(validation_split=0.2) train_generator = datagen.flow_from_dataframe( dataframe=df, directory=image_directory, x_col='filename', y_col=label_strings, subset='training', # Specify subset as training class_mode='raw', target_size=(270, 480), batch_size=32, shuffle=True ) ... and I also create a validating generator, using similar settings. Here's my network architecture: model = Sequential([ layers.InputLayer(input_shape=(270, 480, 3)), # # data augmentation, layers.RandomFlip("horizontal_and_vertical"), layers.RandomRotation(0.025), # preprocessing layers.Rescaling(1./255), # do the work layers.Conv2D(16, 3, padding='same'), layers.Activation("relu"), layers.MaxPooling2D(), layers.Conv2D(32, 3, padding='same'), layers.Activation("relu"), layers.MaxPooling2D(), layers.Conv2D(64, 3, padding='same'), layers.Activation("relu"),…

Cross Validated 2023-12-06 14:50 UTC Score 17.0 AI-113-20231206-social-media-8d653094

median imputation or case deletion for small samples

I have a dilemma. I have a data set of different proteins from 4 groups of animals characterized by two factors: age (3 or 12 months) and presence of a certain gene (SPPL2B, KO or WT). We measured the 'abundance' of about 2000 different proteins in two brain regions of mice of different age and expressing or not the SPPL2B gene, which is important for the development of innate immunity. Because of not normal distributions we planned to apply ARTool to correct ranks for a nonparametric ANOVA. The nonparametric factor ANOVA was intended to verify the effect of age, that of SPPL2B, and possible interactions, on each of the 2000 proteins. For each combination of factors (3m, KO; 12m KO; 3m WT; 12m WT) I have 6 measurements (i.e., 6 animals), except for one group of which I have only 5 measurements. This prevents me from conducting an Aligned Rank Transform to then perform a nonparametric factorial (ANOVA) analysis. Instead, the analysis technically works if (a) I reduce the samples to 5 data points per group, or (b) if I replace the missing data point with the median of the 5 data points of the same group. I really don't know which one is the better solution.

How do we decide the sample size we need for ensuring reliability for a test?
Cross Validated 2023-12-05 19:11 UTC Score 12.0 AI-113-20231205-social-media-761390cf Full article

How do we decide the sample size we need for ensuring reliability for a test?

There is a test consisting of 6 questions and additional sub-Qs. The test was translated into another language and the questions were adapted, but the reliability of the test was never assessed. The test has an existing rubric and scoring, but only questions 2(a) and 2(c) were self-scored in the rubric as those items were added to the existing test. I have provided details about the scoring and the test questions below. MC stands for Multiple-choice OE stands for Open-ended. Item Parts Points 1 a (MC) 2 b (OE) 2 c (OE) 1 Item Parts Points 2 a (OE) 4 b (OE) 1 c (MC) 3 Item Parts Points 3 (MQ) 1 Item Parts Points 4 (MQ) 2 Item Parts Points 5 a (OE) 5 b (OE) 2 c (OE) 2 d (OE) 2 e (OE) 2 f (OE) 2 Item Parts Points 6 a (OE) 2 b (OE) 2 c (MC) 1 d (OE) 4 e (OE) 4 I have three questions: How many participants would I need to check the reliability of the test? If this test was applied to a group of 12 participants, how many of them would need to be checked for inter-reliability by another scorer? Since the rubric was self-scored for questions 2(a) and 2(c) as they were adapted/added, how can we ensure reliability?

Repeated measures Ancova in R [closed]
Cross Validated 2023-12-04 02:09 UTC Score 9.0 AI-113-20231204-social-media-a48a5266 Full article

Repeated measures Ancova in R [closed]

I am trying to analyse my data but I am unsure if repeated measures ancova is the way to go. I have a variable named "A" measured in three different conditions "1", "2" and "3" (the sample size between groups is unequal). I also have a continues covariate measured just once in the first moment. My R code until now is: Rmancova I did try ezAnova in R but it didn't help me as it doesn't incorporate covariates yet.