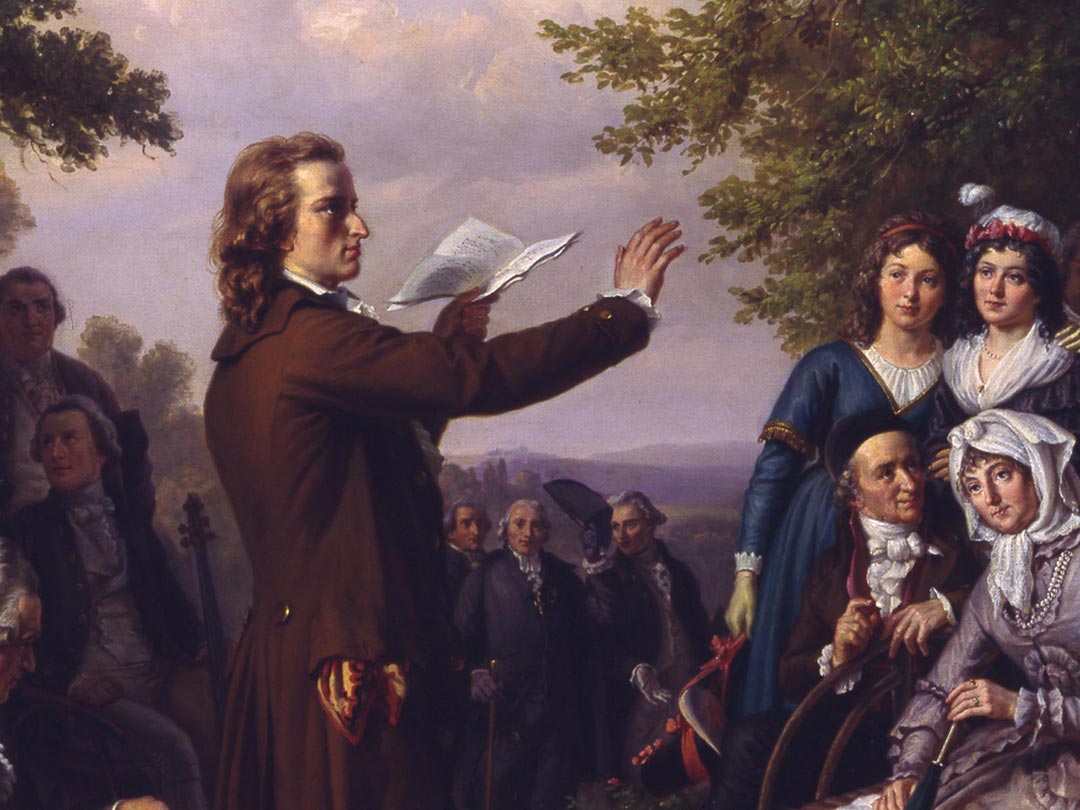
AI Safety and the Age of Dislightenment
Model licensing & surveillance will likely be counterproductive by concentrating power in unsustainable ways
AI/ML news, top picks, and generated innovation digests.
10284 matching items
Model licensing & surveillance will likely be counterproductive by concentrating power in unsustainable ways
Excellent documents for Research and Development
I read this interesting e-print paper on conformal predictors: A Gentle Introduction to Conformal Prediction and Distribution-Free Uncertainty Quantification Conformal predictors are a way to choose a set that's guaranteed to include the true labels with some pre-chosen certainty. I was wondering if there's a way to get conformal predictors to output calibrated probabilities? For example, let's say I have a binary classification (dog or cat images). Conformal predictors can be used to predict whether an image is a dog or a cat in difficult examples. But what I'm looking for is something like calibrated p-values for the prediction. The sigmoid output values (from my neural net, for example) are well known not to reflect actual p-values. Can conformal predictors do this (assuming, of course, I have a calibration dataset available)? If so, can anyone point me to the procedure for this? I can't find it.
Building agents with LLM (large language model) as its core controller is a cool concept. Several proof-of-concepts demos, such as AutoGPT , GPT-Engineer and BabyAGI , serve as inspiring examples. The potentiality of LLM extends beyond generating well-written copies, stories, essays and programs; it can be framed as a powerful general problem solver. Agent System Overview In a LLM-powered autonomous agent system, LLM functions as the agent’s brain, complemented by several key components: Planning Subgoal and decomposition: The agent breaks down large tasks into smaller, manageable subgoals, enabling efficient handling of complex tasks. Reflection and refinement: The agent can do self-criticism and self-reflection over past actions, learn from mistakes and refine them for future steps, thereby improving the quality of final results. Memory Short-term memory: I would consider all the in-context learning (See Prompt Engineering ) as utilizing short-term memory of the model to learn. Long-term memory: This provides the agent with the capability to retain and recall (infinite) information over extended periods, often by leveraging an external vector store and fast retrieval. Tool use The agent learns to call external APIs for extra information that is missing from the model weights (often hard to change after pre-training), including current information, code execution capability, access to proprietary information sources and more. Overview of a LLM-powered autonomous agent syste…

You can take the mean of any number of values, including just one value - in that case, the mean will just be equal to that value. Standardized means (standardized first moments) are always equal to zero. You can't calculate variance (the second standardized moment) for only one value, though - you need a minimum of two values to calculate this moment. Since the variance of one number is zero, the standardized variance would be undefined since you'd have to divide by zero in that calculation. I'm wondering if this pattern holds for higher-order moments . In other words, would it not make sense to calculate kurtosis (the 4 th moment) for three values? I know it's possible to calculate kurtosis for three values, but I'm not sold that doing so will actually tell you anything useful; also, this could be a degrees-of-freedom thing - perhaps there just aren't the degrees of freedom to calculate kurtosis for three values. Is it reasonable to claim that, to calculate the n th moment, you need a minimum of n values? Furthermore, it's interesting that skewness is always 0 for groups of 2 observations (it's obvious why) and kurtosis is always 2 for groups of 3 observations (it's not obvious to me why). Higher-order n th moments do not follow this pattern of always being the same when you have n - 1 observations, and here's some R code to prove it. # Calculating Standardized Second Moments (Variances) for Different # Groups of One Observation One_Observation_Groups
I was hoping someone could help with a problem in my area of Optometry. We use visual fields/perimetry to assess patients visual function. This consists of patient responses (or not) to points of light projected onto various locations on the retina at various stimulus intensities. The dimmest light seen is recorded as the threshold sensitivity at that point. Usually 40-60 separate points are tested across each patients retina and then the overall mean sensitivity is given as the average of all individual point sensitivities. My question is this: since the mean sensitivity consists of 40-60 individually tested points, should p-values associated with changes in the mean sensitivity value over time be adjusted? Currently, no correction is applied in our profession as a whole and I'm now wondering if this is incorrect. If a retinal treatment is applied then several point sensitivities will increase (in a non-independent way) contributing to the overall mean sensitivity increasing, however, should the p-value of significant gain in mean sensitivity be adjusted by a factor of 40-60? This is analagous to questions around p-value adjustment in a repeated measures design, except this isn't exactly repeated measures but separate points that are highly dependent on each other. Thank you for any thoughts on this
For given units of a measure of model complexity, how many examples do we need to train a network to get the model right and generalize?
The winners of the 2022 ACM-AAAI Allen Newell Award were celebrated in person during the 2023 ACM awards ceremony, in San Francisco at the The Palace hotel on Saturday, June 10th, 2023. The post 2022 ACM-AAAI Allen Newell Award appeared first on AAAI .
Could you, please, help me with the following problem? Suppose we have a one-way ANOVA with a single 2-level factor. The dependent variable is a logarithmized value: $y_i = log(Y_i)$ . $y_{iz} = \mu + a_i + \epsilon_{iz}$ $z$ is the number of observations in each $i$ group, different for different $i$ . We want to estimate the contrast: $C = a_1 - a_2$ If we exponentiate this contrast we get a ratio of geometric means of the dependent variable in the two treatment groups on the original scale. $C = \frac{\sum_{h=1}^{z} log(Y_{1h})}{z} - \frac{\sum_{h=1}^{z} log(Y_{2h})}{z}$ $C = log(\prod_{h=1}^{z} Y_{1h}^{\frac{1}{z}})- log(\prod_{h=1}^{z} Y_{2h}^{\frac{1}{z}})$ $C = log(\frac{(\prod_{h=1}^{z} Y_{1h})^{\frac{1}{z}}}{(\prod_{h=1}^{z} Y_{2h})^{\frac{1}{z}}})$ Now, suppose we add additional factors in the model. Importantly, we do not add interaction terms in the model. What do we get if we exponentiate the same contrast from the model with additional variables? Do we still get an adjusted ratio of geometric means of some sort? Have you seen any literature on this? I would appreciate any insights!
I am trying to formulate an RNN that uses attention to easily detect the central element of a sequence. For an RNN alone this is not an easy task but with attention, it should be but I am not entirely certain how to design it. The goal of this question is to understand both mechanisms better. So for example I have (10,20,30) or (10,20,30,40,50) given as input sequence. At input 30 the RNN should output 20 at position 50 -> 30 and so forth. My idea for the RNNs hidden state is to just increase it by 1. The hidden state h would just be a scalar. e.g. (10,20,30) produces the states (1,2,3) But now I am stuck as attention should work with the input and the hidden state. What I would need as output would be scored (0,1,0) * (10,20,30) = 20. The scoring function I come up with would be s(h, number, i) = 1 if h/2 == i else 0 . But there I am using the index as an additional parameter / positional encoding and wondering if I can do it without it. What could be other approaches to handcraft an RNN with attention to extracting the half-position element of a sequence?
I had a lot of fun preparing the talk: “Leadership needs us to do generative AI. What do we do?” for Fully Connected . The idea for the talk came from many conversations I’ve had recently with friends who need to figure out their generative AI strategy, but aren’t sure what exactly to do. This talk is a simple framework to explore what to do with generative AI. Many ideas are still being fleshed out. I hope to convert this into a proper post when I have more time. In the meantime, I’d love to hear from your experience through this process. I couldn’t figure out how to make the slides centered on the page. You might want to download the slides . Thanks everyone who responded to my post and shared your thoughts on what I should include in the talk. Thanks Kyle Gallatin , Goku Mohandas , Han-chung Lee , and Jamie de Guerre for thoughtful feedback on the talk.

The history of technology suggests that the greatest risks come not from the tech, but from the people who control it
Grid'5000 : 20 ans pour une infrastructure unique en recherche informatique alericha mer, 05/24/2023 - 12:05 Depuis son ouverture en 2003, Grid'5000 est devenu le principal instrument national pour la recherche expérimentale en informatique distribuée. Cette infrastructure permet d'étudier des objets informatiques, comme des logiciels ou des systèmes distribués, dans des conditions proches du réel. L'infrastructure est distribuée sur 9 sites (8 en France, 1 au Luxembourg), reliés entre eux par un réseau dédié mis à disposition par Renater et a été financée par les acteurs majeurs de la recherche en informatique française (Inria, CNRS, Universités, grandes écoles, etc.) et par certaines régions. Alors qu’elle célèbre ses 20 ans, elle doit préparer les infrastructures de demain en se rapprochant des communautés de l’internet des objets et des réseaux dans une dimension européenne. © Inria / Photo Kaksonen Une infrastructure à grande échelle pour simuler et tester des applications complexes Grid'5000 est une plate-forme dédiée à l'expérimentation, lancée en 2003. Le projet est né au début des années 2000, lorsqu'il a été constaté qu'il n'existait pas d'infrastructure à grande échelle permettant de tester des algorithmes, des programmes et des applications complexes. En effet les centres de calculs ne permettaient pas de déployer, à grande échelle, des logiciels potentiellement bogués. Les simulateurs étaient soit trop complexes, soit incapables de simuler des grandes applicatio…
I've had it in my head that generally speaking, it's better to freeze layers when fine-tuning an LLM, as per this quote from HuggingFace's article : PEFT approaches only fine-tune a small number of (extra) model parameters while freezing most parameters of the pretrained LLMs, thereby greatly decreasing the computational and storage costs. This also overcomes the issues of catastrophic forgetting, a behaviour observed during the full finetuning of LLMs. PEFT approaches have also shown to be better than fine-tuning in the low-data regimes and generalize better to out-of-domain scenarios. It can be applied to various modalities, e.g., image classification and stable diffusion dreambooth. I think what I might be confused by is what is meant by the "(extra)" part. It led me to try fine-tuning a BERT model in PyTorch by freezing all parameters except for the final feed-forward of the transformer responsible for sequence classification: for param in model.parameters(): param.requires_grad = False for param in model.classifier.parameters(): param.requires_grad = True However, this caused my model to get significantly worse evaluation metrics on my test set than before I did this. This lead me to the following conclusions: My dataset of ~100K datapoints is not of a "low-data regime" and therefore doesn't benefit from PEFT? But doesn't it say this generalizes better to "out-of-domain scenarios"? How do I know the particular seq classification I'm doing with BERT is out-of-domain? Bec…
Here are eight observations I’ve shared recently on the Cohere blog and videos that go over them.: Article: What’s the big deal with Generative AI? Is it the future or the present? Article: AI is Eating The World
I am using YOLOv5 for object detection. I understand that any labelled classes that are not predicted, that is, false negatives (FN) shows up as background. But how are the false positive (FP) being calculated? As in if the background is not explicitly labelled in the data, how are we calculating the false positives? Please see the following confusion matrix for reference. The last row is "background FN". The last column is "background FP". Image source: https://github.com/ultralytics/yolov5/issues/6738
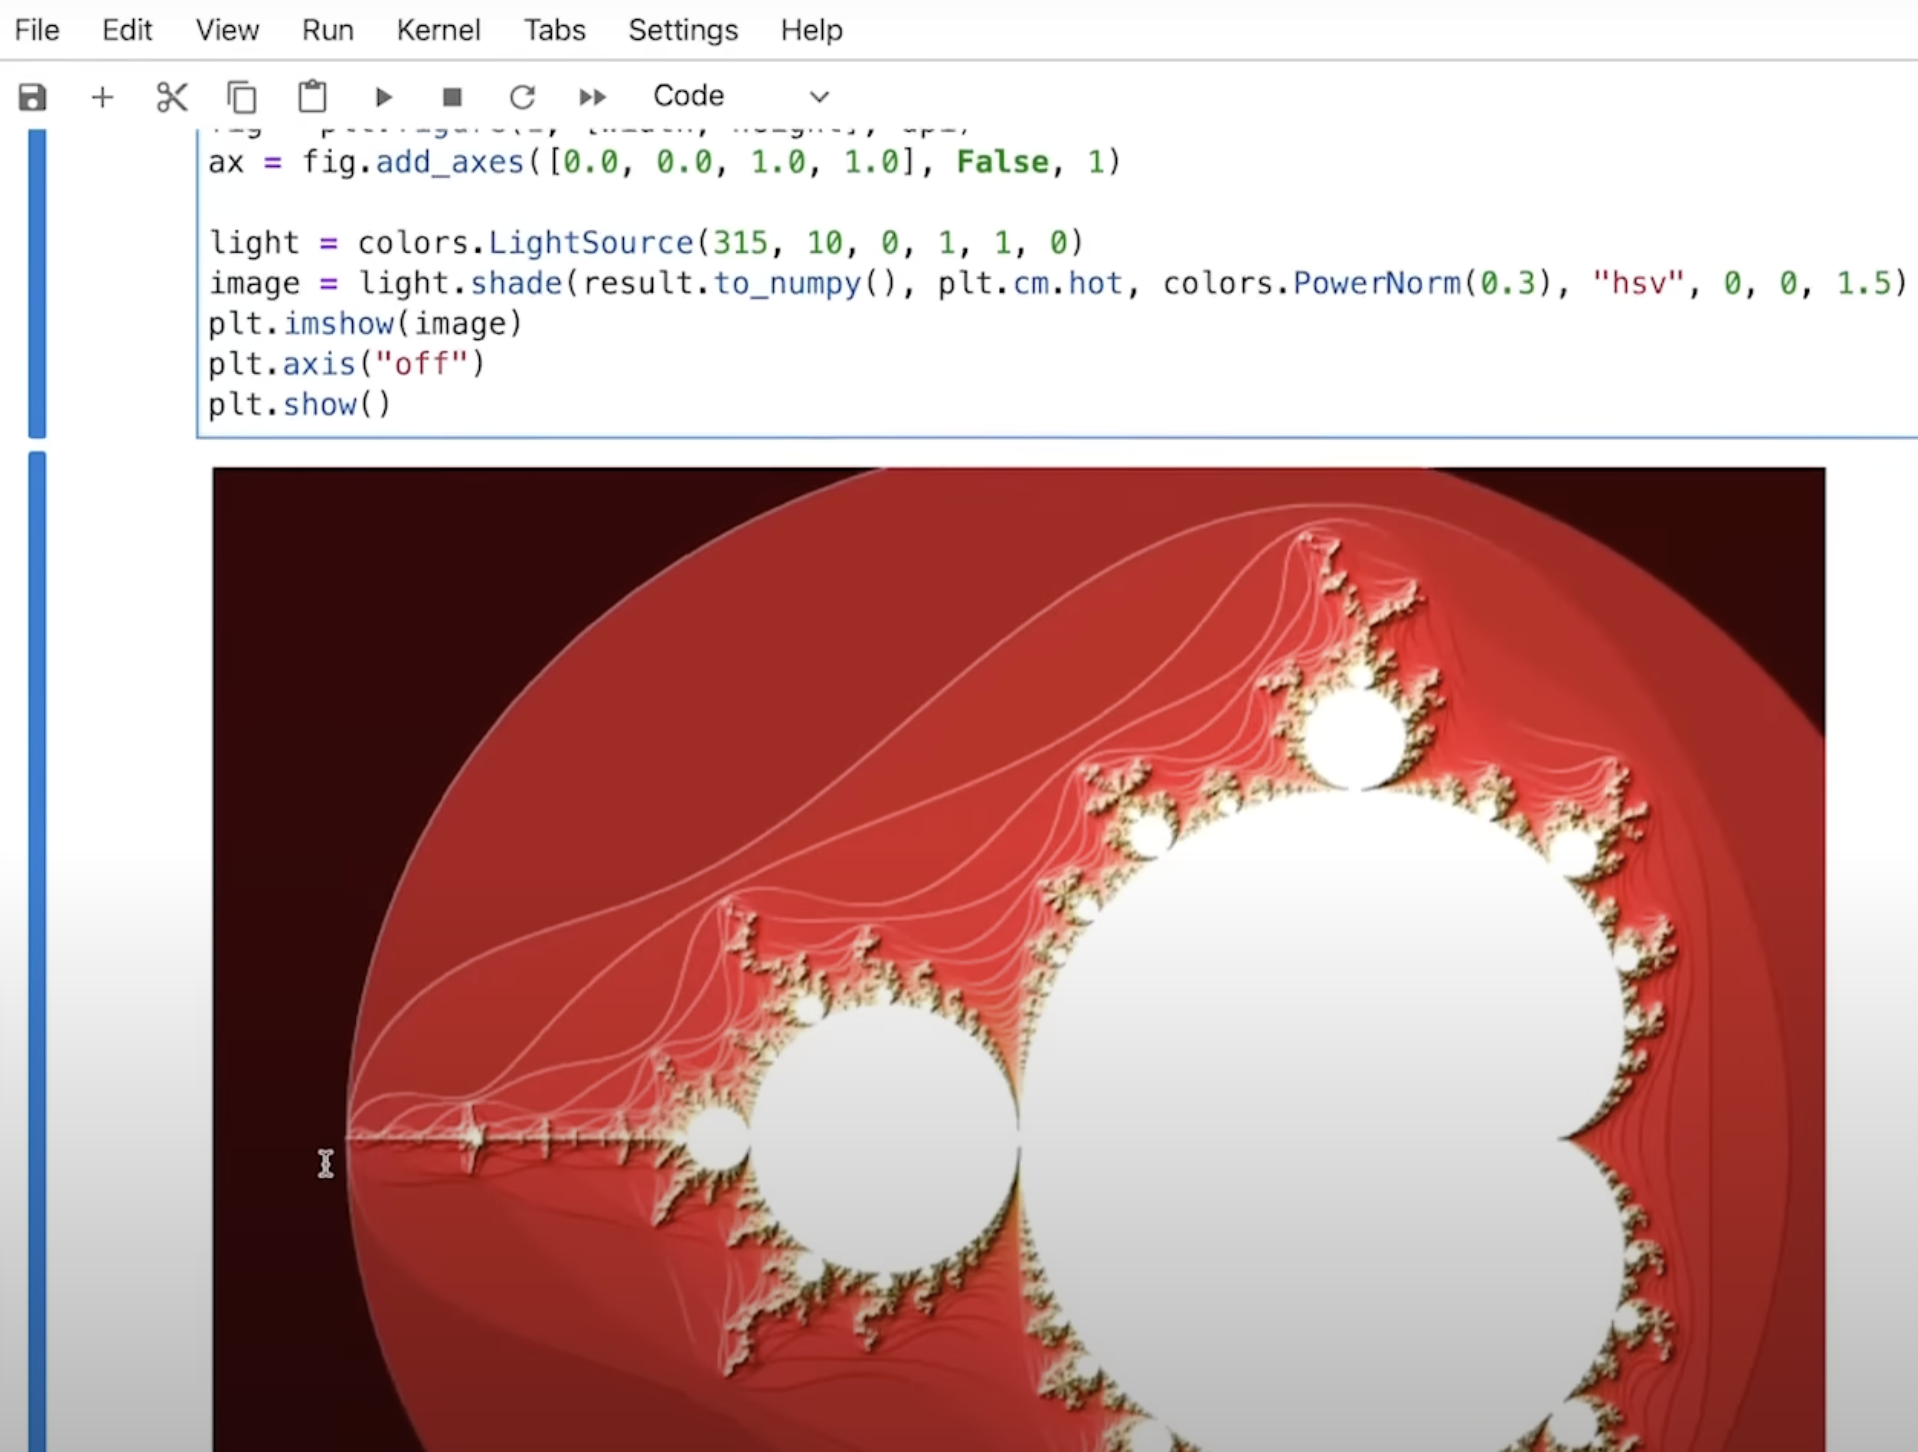
Mojo is a new programming language, based on Python, which fixes Python’s performance and deployment problems.
Recent advances in artificial intelligence (AI) technologies have generated both excitement and concern. As researchers who have served in leadership positions in the Association for the Advancement of Artificial Intelligence (AAAI), we are writing to provide a balanced perspective on managing the progress in the field. We also seek to broaden and strengthen the community of engaged researchers, government agencies, private companies, and the public at large, to ensure that society is able to reap the great promise of AI while managing its risks. [...] The post Working together on the future of AI appeared first on AAAI .
AAAI would like to announce a new way to release code and trained models associated with accepted papers. Through the use of an AI Pubs RAIL License from the RAIL Initiative, authors can elect to release their code and trained models under terms that permit free and open access but are subject to usage restrictions. […] The post RAIL License appeared first on AAAI .
I have a model with a one predictor, one mediator and one outcome. The following are the coefficients i got for my mediation analysis, but I can't understand how to make sense of them. Could someone please help explain what must be going on and how I can report these results. The indirect effect is significant (b = 0.041, CI [0.0103 and 0.0781]) The Total effect is non-significant ((b = 0.016, t = 0.323, p=0.747) The direct effect is non-significant with a flipped sign for the coefficient,( -0.03, p=0.619) is it valid to conduct a mediation in this scenario? how do I report my results. P.S; I ran my analysis with Hayes PROCESS macro P.P.s; I would really appreciate if someone could help soon because I'm on a bit of a time crunch.
We’ve released our new course with over 30 hours of video content.
Suppose our dependent variable Y is TRUE vs FALSE, and our independent variable X is GREEN, YELLOW, and RED. We performed a logistic regression of Y~X. I wonder if it is possible and how to use the trained logistic regression to answer the following question: What is the odds ratio (and p-value) of TRUE vs FALSE for subjects whose X equals to GREEN. What is the odds ratio (and p-value) of TRUE vs FALSE for subjects whose X equals to YELLOW. What is the odds ratio (and p-value) of TRUE vs FALSE for subjects whose X equals to RED.
I am working on a solar energy production forecasting problem using LSTM multi-step models to predict 1/4/8h ahead of solar energy production for different solar installations. Our goal is to help clients optimize their energy utilization by trading with their neighbours or respective Microgrids. I have clustered households into groups such as small generators, medium generators, and large generators. I am currently developing a multi-household model for each cluster using TensorFlow's LSTM multi-step model tutorial . To improve prediction accuracy and provide a more personalized approach, I would like to explore transfer learning to create specialized single-household models based on the generalized multi-household models. Multi-Household Model (Generalized Model) The dataset consists of 160 time series and includes weather features such as hour, day, month, temperature, DHI, DNI, GHI, precipitation, and solar zenith angle. The model learns from multiple similar households. To better visualize the dataset, here is an example: Hour Day Month TS_0 TS_1 TS_N Temperature DHI DNI GHI Cosine Periodicity Sin Periodicity Other Features 6 1 5 0 0 0 15 … … … … … … 7 1 5 0.1 0.1 0.1 17 … … … … … … 8 1 5 0.2 0.3 0.25 18 … … … … … … 9 1 5 0.5 0.4 0.35 18 … … … … … … 10 1 5 1 0.8 0.85 20 … … … … … … Note: These features related to the weather would be an average of the district that these houses exist in. This current setup utilizes TS_0 to TS_N as examples to learn from each other since…
Are all terms in the first line(71) of the equation random variables or probability density functions? If they are probability density functions, is there a possibility of obtaining a value that is not equal to 1 when integrating the right-hand side of the equation after all calculations have been completed? Based on the answer given in line 72, it seems that all terms are considered as probability density functions. If so, is it possible to transform them into the probability density function of a Gaussian distribution? in q(x_{t-1}|x_t,x_0), x_t, x_0, x_{t-1} are EVENTS? or Distribution? I feel like I'm lacking some basic concepts in statistics. Can you help me, please?

Language is a source of limitation and liberation. GPT 4 pushes this idea to the extreme by giving us access to unlimited language.
Prompt Engineering , also known as In-Context Prompting , refers to methods for how to communicate with LLM to steer its behavior for desired outcomes without updating the model weights. It is an empirical science and the effect of prompt engineering methods can vary a lot among models, thus requiring heavy experimentation and heuristics. This post only focuses on prompt engineering for autoregressive language models, so nothing with Cloze tests, image generation or multimodality models. At its core, the goal of prompt engineering is about alignment and model steerability. Check my previous post on controllable text generation.
I wonder if you can help. # create the baseline (on which the for example a model is fitted form which one can sample and derive the uncertainity of the cycle) x $lag, ccf=ccf.res$ acf) } cycl Here this would be possible if a parametric model would exist and just new.data=data.frame(years=1:10) would allow to extrapolate. But how to get there sensibly? Below you find very simple attempt which based on first inspection seems to be plausible but there must be better (and correct) way to estimate it. Sample data and the attempt (in r ): The data are percentages per group and represent the proportion of observations per group of the overall dataset per year (each column should sum to 100% or 1, but because of rounding some might be slightly over 100%). The below data contains 5Y of data and its collected once a year (end of year) and this sample (patients in given category) shifts across these groups. (due to health risk). This current data represents currently lower cycle with lower health risk. The cyclicality is expected due to exogenous factors and have roughly (length of upper or down cycle between 5-10 years. Unfortunately there is limited data on this migration and its expected (assumed) that the current down cycle its just reverse to explain how the upper cycle looks like (just a mirror). The graph below is derived form this code: plot(ccf ~ lag, data=cycl[cycl$group==1, ], col=1, type="l", ylim=c(-1,1)) with(cycl, by(cycl, group, function(x) lines(ccf ~ lag, data=x, col…
I'm currently playing around with LDMs on the MNIST-Fashion dataset. I thought the VQVAEs used in the original paper were a bit overkill for what I'm doing (and I don't fully understand how they construct the discretized codebook latent space), so I went with a simple convolutional autoencoder with a kl-regularizer to map to an approximately gaussian latent space. I've run this model a few times and verified that it does reconstruct the original image inputs fairly well. I run into issues when I try to use this model with my LDM implementation. I first made sure standard diffusion directly in image space works, which it does. I then tried latent diffusion with my trained autoencoder and I can't get the loss to drop below a certain threshold (~1.0), and the image outputs are pretty much gaussian noise still. As stated in the paper, I sample latent vectors from the encoder part of the autoencoder and scale them with stats collected from the first batch of data like so: batch = autoencoder.encode(batch).sample().detach() # rescale the embeddings to be unit variance if epoch == 0 and step == 0: print("Calculating scale factor...") std = batch.flatten().std() scale_factor = 1. / std cfg.scale_factor = scale_factor.item() batch *= scale_factor And then pretty much everything else (applying noise, calculating loss, etc) is the same as standard diffusion. Am I missing something, or is the latent space of my simple conv-autoencoder hard to learn for some reason? I would think that, s…
I had to update Tensorflow to the currently latest version 2.11. when importing i get "AttributeError: module 'tensorflow._api.v2.compat.v2. internal ' has no attribute 'register_load_context_function'". I have also completely reinstalled a full anaconda environment and downgraded Python to the version compatible with the latest of Tensorflow and then "pip3 install Tensorflow==2.11". Got the same error. I have no other ideas. The full error log is the following import tensorflow as tf --------------------------------------------------------------------------- AttributeError Traceback (most recent call last) ~\AppData\Local\Temp\ipykernel_432\3752927832.py in ----> 1 import tensorflow as tf ~\AppData\Roaming\Python\Python310\site-packages\tensorflow\__init__.py in 467 if hasattr(_current_module, "keras"): 468 try: --> 469 _keras._load() 470 except ImportError: 471 pass ~\AppData\Roaming\Python\Python310\site-packages\tensorflow\python\util\lazy_loader.py in _load(self) 39 """Load the module and insert it into the parent's globals.""" 40 # Import the target module and insert it into the parent's namespace ---> 41 module = importlib.import_module(self.__name__) 42 self._parent_module_globals[self._local_name] = module 43 ~\anaconda3\envs\mltrade2\lib\importlib\__init__.py in import_module(name, package) 124 break 125 level += 1 --> 126 return _bootstrap._gcd_import(name[level:], package, level) 127 128 ~\anaconda3\envs\mltrade2\lib\site-packages\keras\__init__.py in 19 """ 20 f…
I have an optimization problem that I solved with grid search using hyperopt in python. In this problem, I have some parameters and a score. I want to find the best parameters that maximize this score. Until now, I didn't see any machine learning algorithms used for solving the optimization task. For example, in classification, we define the problem and use an optimizer (like SGD) to find the best weights. Are there any ML algorithms that can learn how to solve an optimization problem?
AIstroSight : nouvelle équipe-projet commune entre Theranexus, Inria, l’université Claude Bernard Lyon 1 et les Hospices Civils de Lyon, dans le domaine des maladies neurologiques rares mquet ven, 02/10/2023 - 10:03 Theranexus, Inria, l'Université Claude Bernard Lyon 1 et les Hospices Civils de Lyon créent une nouvelle équipe-projet de recherche publique/privée, AIstroSight. Cette équipe-projet a pour objectifs de développer des méthodes numériques innovantes pour la recherche de nouveaux candidats médicaments destinés à traiter les maladies du cerveau, en particulier certaines maladies neurologiques rares. © Inria / Photo B. Fourrier En exploitant le potentiel de l’intelligence artificielle et de la simulation numérique, AIstroSight vise à développer des approches in silico capables d’assister et d’accélérer la recherche de cibles thérapeutiques pertinentes , ainsi qu’à mieux comprendre les processus moléculaires et cellulaires impliqués dans les maladies neurologiques rares et leur traitement . La stratégie de l’équipe consiste à combiner les données biomédicales disponibles (cultures de cellules, imageries médicales, données hospitalières) en une source d'information suffisamment riche et homogène pour son analyse efficace par les algorithmes. Dans ce cadre, AIstroSight élargira son champ de recherche au-delà des neurones pour prendre également en compte les cellules gliales. Ces dernières sont des cellules cérébrales qui assurent la maintenance des neurones et régulent l…
Suppose a particle enters a system at $0.5$ in the unit interval $[0,1]$ . With some probability $\lambda_{right}$ , particles go right by $$x_{right} = \frac{x\pi_{H}}{x\pi_{H} + (1-x)\pi_{L} }$$ and with some probability $\lambda_{left}$ , they go left by $$x_{left} = \frac{x(1-\pi_{H})}{x(1-\pi_{H}) + (1-x)(1-\pi_{L}) }$$ where $1>\pi_{H}>\pi_{L}>0$ , so that $x_{right} \geq x \geq x_{left}$ . These are Bayesian updating formulae. I want to simulate the stationary distribution of this system, where the fraction of particles at each point does not change anymore. At the moment, I don't want to impose any restriction on $\pi_{H}$ and $\pi_{L}$ . If $\pi_{H} = 1-\pi_{L}$ , for instance, I can simplify the position of each particle just by how many net right moves it had and get closed form solution from a second-order recurrence equation, but this is not I want to do. I had two options. (1) Make regular grids from 0 to 1. Depending on $\pi_{H}$ and $\pi_{L}$ , the grid points might not equal the support of positions created in this system, meaning some grid points might not be reached just because of the parameters in the formulae. I just linearly interpolate while finding a fixed point of $v(x) = \lambda_{right} v(x')+ \lambda_{left} v(x'') $ such that $x'_{right} =x$ and $x''_{left} = x$ . However, I'm not sure if this is a mathematically or numerically rigorous method. Most importantly, when I impose $\pi_{H} =1-\pi_{L}$ , it doesn't give me the same simulation result as…
I have read tensorflow's documents about batch normzalization , but still don't get what is the gamma regulizer? the link to document: https://www.tensorflow.org/api_docs/python/tf/keras/layers/BatchNormalization

During a training of a neural network, the test loss reached the its minimum at the x th epoch. Afterwards, I reran the training with the maximum epoch set as x . What is surprising to me is that the test loss in the 2nd run was very different from the 1st at epoch x , even though every other hyper-parameter was the same. The only change I made was the maximum epoch. What could be a possible explanation for this phenomenon? I used the standard DataLoader from Pytorch to shuffle the training data. The seed is also the same.
I am currently working with regression analysis in combination with language analysis on online reviews. I would like to give you a short description of my task and what I want to achieve with it, in order to maybe find a proper solution. I wanted to find possible correlations with the helpfulness score given by the users. For this I used scaled_HS as my dependent variable y . For my variable x I used 63 language features from the LIWC manual . The helpfulness score got scaled by the maximum number of views, to give ratings such as 500 thumbs up and 1000 views a bigger weight than 2 thumbs up and 4 views. Below is a small description of my dataframe: Rating Spoiler HS WC Tone WPS Dic function. ppron i ... swear netspeak assent nonflu filler QMark Exclam keywords mistakes scaled_HS 0 1 0 0.37 150 25.77 16.67 90.67 46.67 5.33 1.33 ... 0.00 0.00 0.00 0.0 0.0 0.00 4.00 0.000000 0.186667 0.017273 1 1 1 0.16 131 1.55 26.20 89.31 58.02 6.87 0.76 ... 0.00 0.00 0.76 0.0 0.0 3.05 0.00 0.000000 0.137405 0.026339 2 1 0 0.24 133 39.19 33.25 92.48 50.38 3.01 2.26 ... 0.00 0.00 0.00 0.0 0.0 0.00 0.00 0.000000 0.097744 0.044079 After applying simple linear regression with the Pearsonr function I found out that some features were significant but had very low coefficients, except HS but I forgot to delete the column, because I have the scaled HS anyways: Coefficients p-value Rating (-0.06201207484873128, 0.015435587631467379) Spoiler (0.059553066433509855, 0.020030343178780382) HS (0.42003896…

Last year, I became captivated by a new topic in a way that I hadn’t felt since I first discovered machine learning
The 2023 recipient of the Feigenbaum Prize is Milind Tambe, for high-impact contributions to the field of artificial intelligence through innovation and achievement in socially beneficial applications of AI in security, healthcare, and conservation. The post Milind Tambe of Harvard University and Google Research Wins 2023 AAAI Feigenbaum Prize appeared first on AAAI .
The 2023 recipient of the Feigenbaum Prize is Milind Tambe, for high-impact contributions to the field of artificial intelligence through innovation and achievement in socially beneficial applications of AI in security, healthcare, and conservation. The post Ayanna Howard of The Ohio State University wins 2023 AAAI/EAAI Patrick Henry Winston Outstanding Educator Award appeared first on AAAI .
Since 2021, the AAAI Award for Artificial Intelligence for the Benefit of Humanity has recognized the positive impacts of artificial intelligence to protect, enhance, and improve human life in meaningful ways with long-lived effects. This year, the AAAI Awards Committee is pleased to announce that the 2023 recipient of the award and $25,000 prize is […] The post Tuomas Sandholm of Carnegie Mellon University wins 2023 AAAI Award for Artificial Intelligence for the Benefit of Humanity appeared first on AAAI .
Many new Transformer architecture improvements have been proposed since my last post on “The Transformer Family” about three years ago. Here I did a big refactoring and enrichment of that 2020 post — restructure the hierarchy of sections and improve many sections with more recent papers. Version 2.0 is a superset of the old version, about twice the length. Notations Symbol Meaning $d$ The model size / hidden state dimension / positional encoding size. $h$ The number of heads in multi-head attention layer. $L$ The segment length of input sequence. $N$ The total number of attention layers in the model; not considering MoE. $\mathbf{X} \in \mathbb{R}^{L \times d}$ The input sequence where each element has been mapped into an embedding vector of shape $d$, same as the model size. $\mathbf{W}^k \in \mathbb{R}^{d \times d_k}$ The key weight matrix. $\mathbf{W}^q \in \mathbb{R}^{d \times d_k}$ The query weight matrix. $\mathbf{W}^v \in \mathbb{R}^{d \times d_v}$ The value weight matrix. Often we have $d_k = d_v = d$. $\mathbf{W}^k_i, \mathbf{W}^q_i \in \mathbb{R}^{d \times d_k/h}; \mathbf{W}^v_i \in \mathbb{R}^{d \times d_v/h}$ The weight matrices per head. $\mathbf{W}^o \in \mathbb{R}^{d_v \times d}$ The output weight matrix. $\mathbf{Q} = \mathbf{X}\mathbf{W}^q \in \mathbb{R}^{L \times d_k}$ The query embedding inputs. $\mathbf{K} = \mathbf{X}\mathbf{W}^k \in \mathbb{R}^{L \times d_k}$ The key embedding inputs. $\mathbf{V} = \mathbf{X}\mathbf{W}^v \in \mathbb{R}^{L \times d_v}$ T…
For a period of ten years, I have to identify, if there are timely variations of impact of the independent variables on the dependent variable. So far, I have run an RE regression for the entire period. But now I have to identify variatins over time. My approach is to run one multilinear regression for the sample for each year from 2011 to 2021. Then, I would compare the coefficients and intercepts in a scatterplot and graph to depict their varying impact over time. Does this make sense? Thank you already for your help! I use Stata and Excel and only have basic experience. I have panel data for ten years (2001-2011), then CSR strategy score is my dependent variable and I would like to understand the impact of different independent variables on the CSR strategy score over time. Would I then create a dummy for each year and what do the interaction coefficients tell me? This is what I have done so far. But I dont know what the coefficients of the year tell me
I need to compute percentile curves using the LMS method (from the GAMLSS package/models) with Age and Height as predictors. What is the best way to determine which equation (with which transformation and type of spline) is the most appropriate? I attempted to consider various models before comparing GAIC to select the best one. However, it takes a long time to consider various scenarios regarding whether either sigma, nu,tau should be constant or not. or the type of transformation that should be used. So any suggestions for finding the best model would be greatly appreciated. library(tidyverse) df=read.csv("https://raw.githubusercontent.com/kinokoberuji/R-Tutorials/master/LMSmodelGAMLSS.csv", sep=";")%>%as_tibble() m1
[Updated on 2023-01-24: add a small section on Distillation .] Large transformer models are mainstream nowadays, creating SoTA results for a variety of tasks. They are powerful but very expensive to train and use. The extremely high inference cost, in both time and memory, is a big bottleneck for adopting a powerful transformer for solving real-world tasks at scale. Why is it hard to run inference for large transformer models? Besides the increasing size of SoTA models, there are two main factors contributing to the inference challenge ( Pope et al. 2022 ):
Washington, DC, USA (January 24, 2023) – AAAI announced today the winners of its 2023 awards that will be presented at the 37th Annual Conference on Artificial Intelligence (AAAI-23). This event will be held in person at the Walter E. Washington Convention Center in Washington, DC from February 7-14, 2023. Several awards will be given, […] The post The 37th AAAI Conference on Artificial Intelligence Aims to Build Bridges appeared first on AAAI .
Can AI Image generation tools make re-imagined, higher-resolution versions of old video game graphics? Over the last few days, I used AI image generation to reproduce one of my childhood nightmares. I wrestled with Stable Diffusion, Dall-E and Midjourney to see how these commercial AI generation tools can help retell an old visual story - the intro cinematic to an old video game (Nemesis 2 on the MSX). This post describes the process and my experience in using these models/services to retell a story in higher fidelity graphics. Meet Dr. Venom This fine-looking gentleman is the villain in a video game. Dr. Venom appears in the intro cinematic of Nemesis 2, a 1987 video game. This image, in particular, comes at a dramatic reveal in the cinematic. Let’s update these graphics with visual generative AI tools and see how they compare and where each succeeds and fails. Remaking Old Computer graphics with AI Image Generation Here’s a side-by-side look at the panels from the original cinematic (left column) and the final ones generated by the AI tools (right column): This figure does not show the final Dr. Venom graphic because I want you to witness it as I had, in the proper context and alongside the appropriate music. You can watch that here:
I have 10 independent variables (IV) that may predict my dependent variable. There's a lot of multicollinearity in my data (r between IVs is r=0.4 on average but not higher than r=0.8). I suspect that's because of layered effects: Like IV2 and IV3 directly influence the dependent variable, but IV2 itself is influenced by IV4 and IV7. I'm looking for the right terminology for search: Which keywords/methods can help me to interpret the causality of my model and the layered effects structure?
I'm so confused regarding the test of CAPM with its hypothesis. So we have these null hypothesis, right? H0: α = 0, β ≠ 0 If the estimates of intercept a is something 0.4 and t-stat is something insignificant i.e. 1.2, the CAPM holds and it points out that the intercept a = 0, right?. But beta that measures the market risk in my case confuses me more. What if the t-stat of the beta is also insignificant? We would be happy, since we can't reject the null that beta is more than 0. The CAPM holds in such cases? Is it all correct?